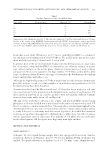
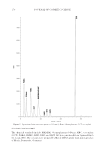
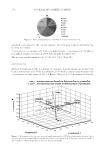
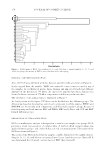
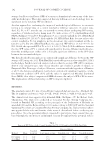
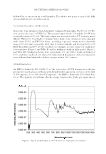
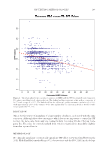
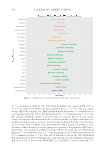
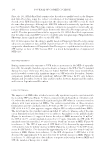
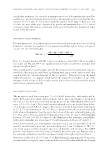
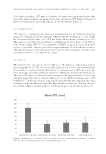
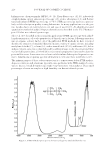
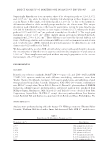
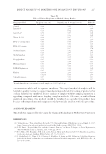
SPF TESTING METHODOLOGIES 189 DISCUSSION This i s the fi rst report of an analysis of a large number of subjects, each tested with the same sunscreen. Although these data can suggest which factors are important to control in SPF testing, the data come from only one testing facility, Consumer Product Testing Com- pany, Inc. The value for control standard from other testing facilities may differ slightly from that reported herein. METHODOLOGY No cl inically sig nifi cant or statistically signifi cant SPF effect on P2 was found between the 2011 FDA-Final Rule methodology (952 observations) and the ISO 24444 methodology Figure 3. The relationship between a subject’s unprotected MED and the SPF for standard control s u nscreen P2, when controlling for all other predictors. The dashed red line represents a line with a y intercept of 18.579 and a slope of -0.155. The dashed red line has a Pearson’s product-moment correlation of -0.409, with approximately 23% of the variance of the data explained by the linear mixed-effects model (Condi- tional (pseudo)-R2 = 0.227).

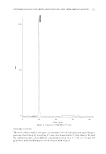
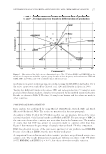
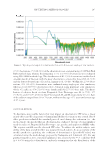
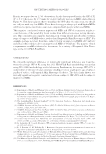
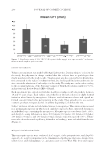
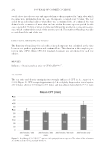
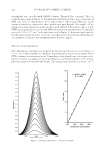
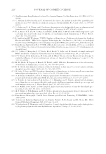
JOURNAL OF COSMETIC SCIENCE 190 (1,551 observations) (Table I). For 2011 FDA-Final Rule, the expected SPF of P2 is 16.3 ± 3.43 and for ISO 24444, the expected SPF of P2 is 16.1 ± 2.42. The least square average SPF for P2 using the 2011 FDA-Final Rule methodology was 15.4 (standard error = 0.12) and that using the ISO 24444 methodology was 15.6 (standard error = 0.10). Un- like a simple arithmetic average of the data using no statistical model, the least square average incorporates the linear mixed-effects statistical model used prior and adjusts the estimated average based on covariates present inside the model. For this reason, the least square average with a standard error, rather than the simple unadjusted arithmetic aver- age with standard deviation is a more appropriate estimate of the population SPF values. Nonetheless, the unadjusted arithmetic average SPF for P2 using the 2011 FDA-Final Rule was 15.4 (standard deviation = 2.57) and that using the ISO 24444 methodology was 15.7 (standard deviation = 2.40). This lack of difference between the 2011 FDA-Final Rule method and the ISO 24444 method is consistent with the earlier fi ndings of Garzarella and Caswell (2013) between the FDA-FM (1,2), Aus/NZ (3), and International (4,5) Figure 4. Comparison of estimated populations’ SPF values among groups.
Purchased for the exclusive use of nofirst nolast (unknown)
From: SCC Media Library & Resource Center (library.scconline.org)