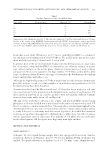
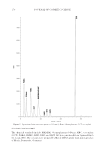
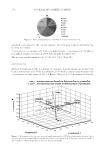
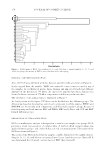
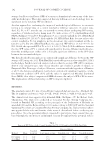
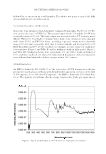
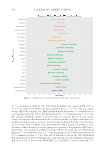
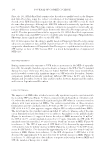
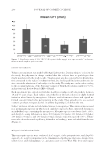
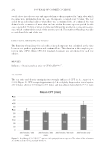
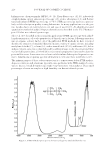
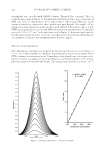
SPF TESTING METHODOLOGIES 185 2,503 observations, 952 (38.03%) of the observations were evaluated using 2011 FDA-Final Rule methodology, whereas the remaining 1,551 (61.97%) observations were evaluated using ISO 24444 methodology. The distribution of all 2,503 observations involved each calendar month of the year, with the most observations collected in June (288, 11.51%) and the fewest observations collected in January (101, 4.04%). Within the 2,503 obser- vations, 291 (11.63%) observations were evaluated using single-port solar simulators, whereas 2,212 (88.37%) observations were evaluated using multiport solar simulators. Of the 652 subjects, 470 (72.09%) were female and 182 (27.91%) were male. The distri- bution of subjects based on their Fitzpatrick Skin Phototype was 44 (6.75%), 377 (57.82%), and 231 (35.43%) for Skin Phototypes I, II, and III, respectively (15,16). Ages of the subjects ranged from 18 to 70 years, with a median age of 51 years and a mean age of 47.6 years. STATISTIC AL METHODS To determ ine any possible factors that may impact an observation’s SPF value, a linear mixed-effects model using restricted maximum likelihood estimation was created. Fixed- effect predictors included the standard protocol used during the evaluation (i.e., the method used): the month when an observation was evaluated, the type of solar simulator used, the subject’s Fitzpatrick Skin Phototype, age, gender, and unprotected MED value. The response variable was the observed SPF value. To address the within-subjects vari- ability of the data, a random effect was assigned for each subject. As an assessment of the model’s predictive capability, the coeffi cient of determination [(pseudo)-R2 value] was calculated using the methodology proposed by Nakagawa and Schielzeth (17). For any pairwise hypothesis tests, statistical signifi cance was achieved at the 95% confi dence level (p 0.050) using the t-distribution, under the assumption that the distribution of the Figure 2. T ypical spectral output of six light guides from a 300-W xenon arc single-port solar s i mulator.

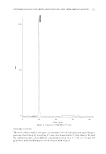
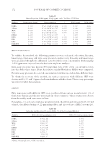
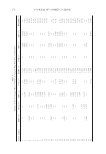
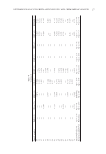
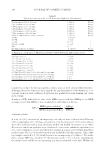
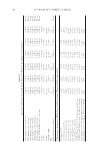
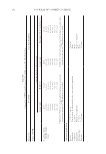
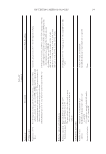
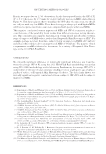
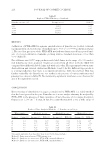
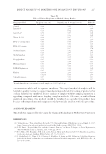
Table III Typical Spectral Output of Six Light Guides from a 300-W Xenon Arc Multiport Solar Simulator Total irradiance (250–1,600 nm) 1.22E-01 1.21E-01 1.20E-01 1.26E-01 1.20E-01 1.27E-01 W/cm2 UVC irradiance (250–290 nm) 3.15E-07 1.96E-07 1.15E-07 1.91E-07 2.79E-08 2.86E-07 W/cm2 UVB irradiance (290–320 nm) 1.24E-02 1.24E-02 1.21E-02 1.25E-02 1.24E-02 1.25E-02 W/cm2 UVA irradiance (320–400 nm) 1.08E-01 1.07E-01 1.06E-01 1.11E-01 1.06E-01 1.12E-01 W/cm2 UVA2 irradiance (320–340 nm) 3.20E-02 3.18E-02 3.12E-02 3.25E-02 3.16E-02 3.29E-02 W/cm2 UVA1 irradiance (340–400 nm) 7.60E-02 7.51E-02 7.51E-02 7.89E-02 7.46E-02 7.94E-02 W/cm2 Visible + NIR irradiance (400–1,600 nm) 1.64E-03 1.67E-03 1.76E-03 1.87E-03 1.76E-03 1.79E-03 W/cm2 %UVC 0.0003% 0.0002% 0.0001% 0.0002% 0.0000% 0.0002% %UVB 10.13% 10.23% 10.08% 9.93% 10.28% 9.90% %UVA 88.52% 88.39% 88.46% 88.58% 88.26% 88.68% %Visible + NIR 1.35% 1.38% 1.46% 1.49% 1.46% 1.42% SED 11.9 11.9 12.2 11.8 11.7 11.8 s Erythemal effective irradiance 8.38E-04 8.42E-04 8.22E-04 8.48E-04 8.52E-04 8.48E-04 W/cm2 % Erythemal contribution of FDA (June 2011)/ISO 24444 SPF method (November 2010) 290nm (0.1 % ) 0.04% 0.02% 0.01% 0.02% 0.00% 0.03% 290–300 nm (1.0–8.0%) 4.45% 4.65% 4.57% 4.52% 4.83% 4.49% 290–310 nm (49.0–65.0%) 55.88% 56.14% 56.01% 55.85% 56.84% 55.62% 290–320 nm (85.0–90.0%) 87.03% 87.15% 87.08% 86.92% 87.46% 86.79% 290–330 nm (91.5–95.5%) 93.02% 93.15% 93.04% 92.91% 93.28% 92.84% 290–340 nm (94.0–97.0%) 95.39% 95.46% 95.39% 95.29% 95.57% 95.25% 290–400 nm (99.9–100.0%) 99.96% 99.98% 99.99% 99.98% 100.00% 99.97% %UVA2/Total UV (20%) (320–340 nm/290–400 nm) 26.59% 26.63% 26.37% 26.23% 26.63% 26.34% %UVA1/Total UV (60%) (340–400 nm/290–400 nm) 63.14% 63.00% 63.41% 63.69% 62.93% 63.62% Total irradiance 250–1,400 nm for FDA (1,500 W/m)2 1,220 1,209 1,201 1,258 1,202 1,266 Total irradiance 250–1,500 nm for ISO (1,600 W/m)2 1,220 1,209 1,201 1,258 1,203 1,266 JOURNAL OF COSMETIC SCIENCE 186
Purchased for the exclusive use of nofirst nolast (unknown)
From: SCC Media Library & Resource Center (library.scconline.org)