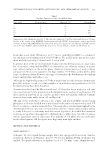
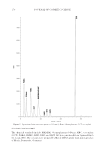
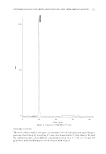
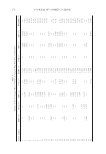
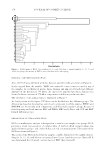
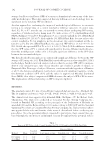
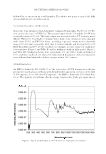
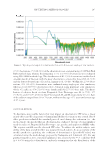
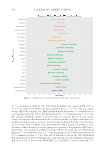
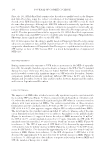
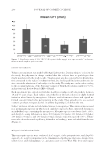
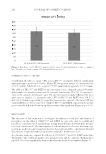
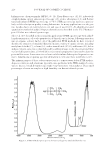
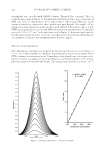
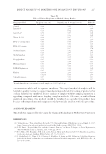
DETERMINATION OF SUNSCREEN AGENTS BY HPLC AND CHEMOMETRIC ANALYSIS 171 STANDARD SOLUTI ON The stock solut ion with 1,000 ppm concentration level of each sunscreen agent was pre- pared in ethanol daily by dissolving 250 mg of each material in 250 ml ethanol. To draw the calibration curve, seven different concentration levels (1, 2.5, 5, 10, 25, 50, and 100 ppm) were made by diluting the stock solution with ethanol. Figure 2. Separation o f BMDBM at 390 nm.

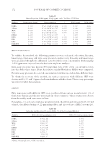
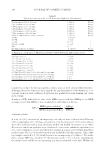
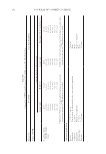
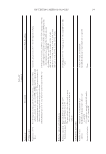
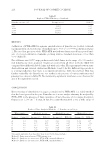
JOURNAL OF COSMETIC SCIENCE 172 T a ble II Linear Equation, LOD (ppm), LOQ (ppm), and r2 for Nine UV Filters Analyte Linear range (ppm) Linear equation r2 LOD (ppm) LOQ (ppm) PABA 1–100 Y = 1.448X + 0.828 0.999 1.325 4.016 3-Benz 1–100 Y = 1.245X + 0.527 0.999 0.946 2.923 MBC 1–100 Y = 1.968X + 2.05 0.999 0.677 2.053 OCT 1–100 Y = 0.855X + 0.41 0.999 1.088 3.297 EHMC 1–100 Y = 1.797X + 0.237 1 0.439 1.330 HMS 1–100 Y = 0.307X + 0.291 0.999 1.481 4.490 EHS 1–100 Y = 0.353X - 0.007 0.999 1.322 4.008 EHT 1–100 Y = 3.201X + 3.115 0.999 0.813 2.464 BMDBM 1–100 Y = 1.072X + 0.111 0.999 0.572 1.733 Table III Intra-day and Inter-day Precision (RSD, %) of the Developed Method Analyte RSD (%) (intra-assay precision) RSD (%) (inter-assay precision) PABA 0.39–1.88 0.791 3-Benz 0.34–1.46 0.387 MBC 0.81–2.05 0.425 OCT 0.52–3.86 0.553 EHMC 0.25–2.14 0.935 HMS 0.61–1.73 0.333 EHS 0.27–1.9 0.420 EHT 0.8–2.03 0.224 BMDBM 0.61–1.35 0.683 3-Benz: 3-benzophenone, OCT: octocrylen. METHOD VALIDATI ON To validate the method, the following parameters were evaluated: selectivity, linearity, linear range, inter-assay and intra-assay precision, and recovery. Linearity and linear range were calculated through the calibration curve for which seven concentration levels ranging 1–100 ppm were injected into the device in triplicate analyses. Intra-assay pre cision was measured by injecting each of the seven concentration levels into the device three times. Next, the relative standard deviations (RSDs) were computed. For inter-assay precision, the selected concentration level was injected on three different days. To obtain the r ecovery of the method, six various sunscreens with different SPFs were chosen, and 10, 25, and 50 ppm of each standard were added to them. The recovery percentage was reported after data analysis. SAMPLES Fifty s unscreen s with different SPFs were purchased from various manufacturers (32 of them were Iranian and the rest were made in other countries). These creams were chosen from the widely used sunscreens in Iran. For analysis, 0 .1 g of each cream was weighed, mixed, dissolved, and extracted with 100 ml ethanol then fi ltered using a 0.22-μm syringe fi lter and injected into a HPLC system (26).
Purchased for the exclusive use of nofirst nolast (unknown)
From: SCC Media Library & Resource Center (library.scconline.org)