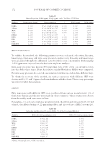
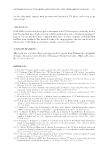
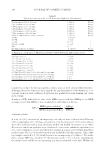
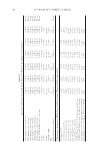
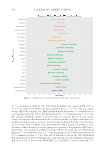
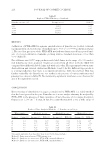
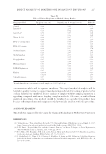
Parameters ISO 24444 2011 FDA-Final Rule UV Exposures Progression of UV Dose For the unprotected area and the protected areas, a minimum of fi ve subsites centered on the expected SPF × MEDu shall be exposed with a maximum geometric progression of 1.25n. The progression must be identical for the unprotected and protected areas. Geometric progression (1.25n) for the unprotected area A maximum progression of 1.12nmust be used for expected SPF 25 For the protected areas, geometric series of fi ve exposure where the middle exposure is placed to yield the expected SPF plus two other exposures placed around the middle exposure According the expected SPF (X) SPF 8: 0.64X, 0.80X, 1.00X, 1.25X, 1.56X SPF 8 to 15: 0.69X, 0.83X, 1.00X, 1.20X, 1.44X SPF 15: 0.76X, 0.87X, 1.00X, 1.15X, 1.32X Reference sunscreen formulations Reference sunscreen formulations used Expected SPF 20: P2 or P3 or P7 P2 (Padimate O 7.0% + Oxybenzone 3.0%) with SPF 16.3 (SD: 3.43) Expected SPF ≥20: P2 or P3 The same reference has to be tested on every subject in the same series of at least 10 subjects Calculations and results Number of test subjects Minimum of 10, maximum of 25 At least 10 valid no maximum Invalid data from up to fi ve subjects are acceptable Invalid data from up to three subjects is acceptable Statistical criterion 95% confi dence interval should fall within ±17.0% of mean SPF None Table IV Continued SPF TESTING METHODOLOGIES 193

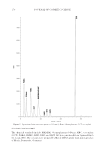
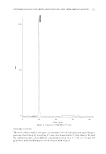
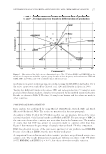
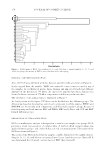
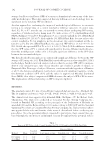
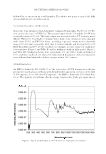
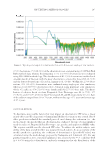
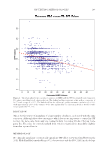
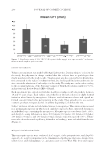
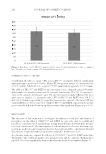
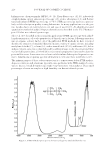
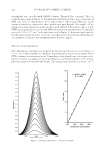
JOURNAL OF COSMETIC SCIENCE 194 First, the 2011 FDA-Final Rule requires that the subjects qualify based on the Fitzpat- rick Skin Phototype using the subject’s recollection of his burning/tanning response. Second, 2011 FDA-Final Rule requires that the subjects in a valid SPF test not be of all the same skin phototype. Although the ANOVA indicated a statistically signifi cant im- pact for Fitzpatrick Skin Phototype, pairwise comparisons revealed no statistically sig- nifi cant differences in mean SPF values between the three Skin Phototype groups, I, II, and III. The data presented herein fail to support the 2011 FDA-Final Rule requirement that the subjects in a valid SPF test not be of all the same skin phototype. Fitzpatrick Skin Phototype has no signifi cant effect on the SPF of P2. ISO 24444 requires that the subjects qualify based on Fitzpatrick Skin Phototype using subjective assessment or have an ITA of greater than 28° (7). The data presented herein support the abandonment of Fitzpatrick Skin Phototype as a qualifi cation for subjects in SPF testing, in favor of ITA° because ITA° is a much better predictor of unprotected MED (23). SE ASONAL VARIATION Du ring summer months exposure to UVR induces an increase in the MED of a popula- tion (24). One might, therefore, expect to observe a change in the SPF of the P2 standard during the course of the year. This was not found. ANOVA of the linear mixed-effects model revealed a statistically signifi cant impact on SPF values for December. Pairwise comparisons yielded statistically signifi cant different SPF values for P2 only between January and December, between June and December, between August and December, and between September and December. UN PROTECTED MED Th e unprotected MED value revealed a statistically signifi cant negative correlation with the resulting SPF value (Figure 3). This is consistent with the hypothesis of Damian et al. (9), whose data indicated statistically signifi cant higher SPF values in sunscreen tested on subjects with lower unprotected MEDs. The authors reported data on three sunscreen formulations and two standard controls, P3 with an SPF of 15.7 ± 2.0 (7) and P7 with an SPF of 4.4 ± 0.4 (7), that appear to support a higher SPF on subjects with lower MEDs. The data from the two standard controls included 17 subjects, whereas each of the sun- screen formulations had data from 10 or 12 subjects. An analysis on the published plot (Figure 3a in reference 9) suggested that as the subject’s MED increases by 10 mJ/cm2, the SPF of the P7 control standard decreases by 0.35 units. Similarly, the SPF of the P3 standard control decreased by 1.09 units for every 10 mJ/cm2 increase in MED (Figure 3b in reference 9). The SPF of sunscreen A (SPF label is 15+) decreased by approximately 1.88 units for every 10 mJ/cm2 increase in MED (Figure 4a in reference 9) the SPF of sun- screen B (SPF label is 15+) decreased by approximately 4.07 units for every 10 mJ/cm2 increase is MED (Figure 4a in reference 9) the SPF of sunscreen C (SPF label is 30+) decreased by approximately 8.42 units for every 10 mJ/cm2 increase in MED (Figure 4a in reference 9). Although these data indicate a negative relationship between MED and SPF, the number of data points is small.
Purchased for the exclusive use of nofirst nolast (unknown)
From: SCC Media Library & Resource Center (library.scconline.org)