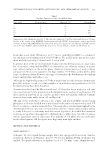
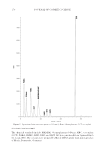
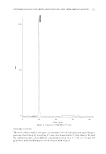
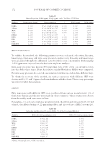
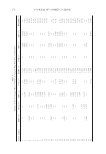
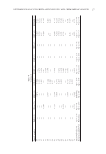
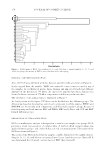
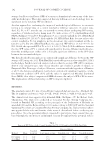
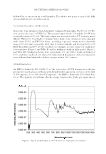
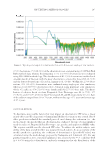
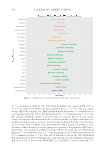
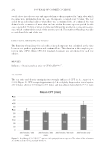
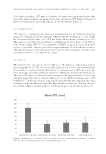
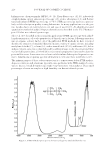
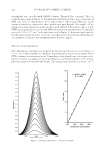
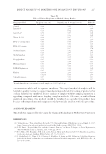
DETERMINATION OF SUNSCREEN AGENTS BY HPLC AND CHEMOMETRIC ANALYSIS 173 Table IV Accuracy Results Obtained through the Recovery Test Analyte % Recovery 10 (ppm) 25 (ppm) 50 (ppm) PABA 98.591 100.234 102.560 3-Benz 100.145 99.169 99.672 MBC 97.681 99.783 101.528 OCT 99.966 100.333 100.997 EHMC 102.343 98.925 103.140 HMS 101.531 98.867 103.778 EHS 98.026 100.185 102.485 EHT 101.555 100.413 100.050 BMDBM 100.490 99.467 102.769 HPLC-UV ANALYSIS In the current s tudy, the mobile phase was prepared by adding 0.1 M phosphoric acid to distilled water (solvent A) and ethanol (solvent B) to obtain 1% concentration in each of them. The gradient condition shown in Table I was applied. RESULT AND DISCUS SION CHROMATOGRAPHY Th e reversed-phas e HPLC method was developed for the detection and measurement of the amount of nine different UV fi lters in creams. Fifty-two creams from diverse brands were screened. Figures 1 and 2 show the chromatographic separation of these materials. LINEARITY AND LIN EAR RANGE To calculate the linearity, nine UV fi lters that were prepared in seven concentration levels (1, 2.5, 5, 10, 25, 50, and 100 ppm) were injected into the HPLC system. The areas were considered and the calibration curves were drawn. Limit of detection (LOD) and limit of qualifi cation (LOQ) were estimated based on the standard deviation of the response and the slope of the curves. The results are shown in Table II. INTRA-ASSAY AND INT ER-ASSAY PRECISION (REPEATABILITY AND REPRODUCIBILITY) Repeatability of th e method was estimated by applying three frequent injections of the mixture of nine UV fi lters at the different concentration levels (1, 2.5, 5, 10, 25, 50, and 100 ppm) in 1 d. All of the RSDs were less than 4%, which seemed to be appropriate. Reproducibility was estimated by injecting 50 ppm concentration level in three different days. The upper range of RSD for each of the components was more than 1. The RSD for each component is shown in Table III. RECOVERY Six different creams w ere selected from common Iranian sunscreens. For analysis, 0.1 g of each cream was weighed and extracted by ethanol. Then, 10, 25, and 50 ppm of UV-fi lter

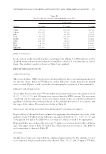
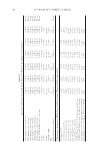
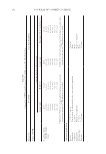
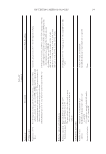
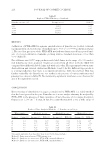
Table V Results of the Percentage of Each UV Filter in Samples That Was Detected by HPLC Sample number PABA (%) 3-Benz (%) MBC (%) OCT (%) EHMC (%) HMS (%) EHS (%) EHT (%) BMDBM (%) 1 — — — — 0.253 — 0.214 0.124 — 2 — — 0.293 0.438 0.140 — 0.100 0.806 0.306 3 — — — 0.743 0.695 — 0.942 0.199 0.226 4 0.221 — 0.166 — 0.716 — — — 0.143 5 — — — — 0.775 — — — 0.564 6 — — — — — — — — 0.231 7 — — 0.300 — 0.885 — — — 0.176 8 — 0.316 0.292 0.170 0.918 — — — 0.100 9 — — 0.264 0.330 0.739 — — — 0.114 10 — — 0.186 — 0.112 — — — 0.122 11 — — 0.244 — 0.113 — — — 0.323 12 — 0.343 — — 0.597 — — — 0.164 13 — 0.903 0.412 — 0.954 — 0.526 0.900 — 14 0.819 0.242 — — 0.986 — 0.519 — — 15 — — — — 0.356 — — — 0.541 16 — — — 0.594 0.452 — — 4.440 0.541 17 — — — — 0.240 — 0.223 0.001 — 18 — — 0.01 0.453 0.147 — 0.102 0.008 0.316 19 — — 0.005 0.739 0.702 — 0.009 0.210 0.223 20 0.210 — 0.159 — 0.722 — — — 0.137 21 — — — — 0.769 — — — 0.563 22 — — — — 0.783 — — — 0.245 23 — — 0.315 — 0.879 — — — 0.164 24 — 0.322 0.302 0.001 0.900 — — — 0.001 25 — — 0.259 0.003 0.726 — — — 0.010 26 — — 0.179 — 1.134 — — — 0.108 27 — — 0.243 — 1.129 — — — 0.317 28 — 0.373 — — 0.601 — — — 0.158 29 — 0.009 0.150 — 0.523 — — — — 30 0.083 0.237 — — 1.001 — 0.522 — — 31 — — — — 0.348 — — — 0.539 32 — — — 0.601 0.040 — — 4.390 0.538 JOURNAL OF COSMETIC SCIENCE 174
Purchased for the exclusive use of nofirst nolast (unknown)
From: SCC Media Library & Resource Center (library.scconline.org)