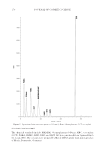
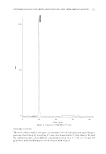
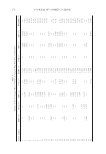
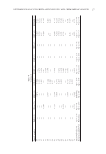
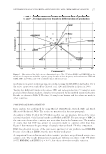
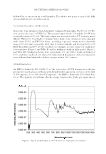
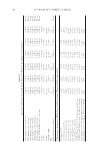
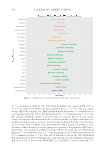
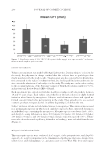
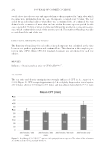
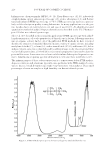
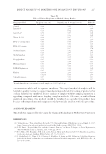
DETERMINATION OF SUNSCREEN AGENTS BY HPLC AND CHEMOMETRIC ANALYSIS 177 used sunscreen agents in Korean sun care products using the RP-HPLC method in 2014. Six active agents were studied by Chisvert et al. (28) and Salvador in Spain in 2000. Twenty-fi ve different brand s with various SPFs and series production (50 samples) were purchased from Iranian markets. Samples were prepared by the method mentioned earlier. Results are shown in Table V. The fi rst 32 samples are Iranian and the others are made in other countries. STATISTICAL DATA ANALYSIS D ata analysis was performed by using Matlab (MathWorks, Natick, MA) and Excel (Microsoft Redmond, WA). The results are mentioned in the next paragraph. According to Table V, all o f the UV fi lters used in sun care products followed the inter- national standards. Only Iranian brands used PABA and EHS. The percentage of MBC in the sunscreens from other countries was more than that in the Iranian ones. The number of creams that had OCT was greater in sunscreens made in countries other than Iran. Figure 3 demonstrates the percentage of samples that used each UV-fi lter component. HMS was observed in none of the sunscreens, and most of our products used BMDBM because of its effi cacy. EHMC was the most widely used agent. A comparison between Irania n and other countries’ products was performed using a two- sample t-test. The results demonstrated signifi cant difference in three of the UV fi lters (OCT, BMDBM, and EHMC) (p 0.05), but others showed no notable variation. Figure 5. Illustration of the biplot in two-dimensional space. The UV fi lters EHMC and BMDBM are the mostly used components and make separate groups because of their frequency and total amount. EHS and PABA, MBC and 3-Benz, and OCT and EHT formed different groups.

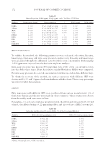
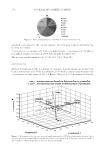
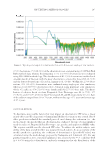
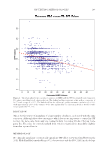
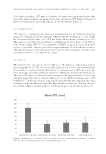
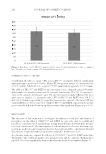
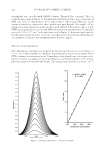
JOURNAL OF COSMETIC SCIENCE 178 PRINCIPAL COMPONENT ANALYSI S (PCA) Also, the PCA was performed with this data set, and the results are shown in Figure 4. In the original data, the v ariable “HMS” was omitted because it was not used in any of the samples. As is illustrated in this fi gure, Iranian and imported brands had different amounts of the mentioned UV fi lters. As opposed to imported products, Iranian ones showed a diverse amount of UV-fi lter components in different production dates. The 2D biplot of the analyz ed data is illustrated in Figure 5. As clearly shown in this fi gure, UV fi lters can be divided into fi ve different groups. The division was based on the algebraic sum of each component in all the samples. EHMC and BMDBM are the mostly used components, and they make separate groups because of their frequency and total amount. EHS and PABA, MBC and 3-Benz, and OCT and EHT formed different groups. HIERARCHICAL CLUSTER ANALYS IS (HCA) HCA is a multivariate analy sis technique that is used to sort samples into groups. HCA provides a visual representation of complex data. A method called average linkage was applied between groups, and cityblock was selected as a measurement. The results of the HCA are shown in Figure 6. The results of the HCA show ed that the samples could be divided into two quality clusters. Samples 16, 32, 39, and 48 were categorized into Cluster I and the rest into Cluster II. It was determined that Cluster I contains more of EHT than Cluster II. Figure 6. Dendrograms of H C A. Class numbers 11, 16, and 24 belong to sample numbers 16, 32, 39, and 48. In this group, the amount of EHT is more than that in the other group.
Purchased for the exclusive use of nofirst nolast (unknown)
From: SCC Media Library & Resource Center (library.scconline.org)