SPF TESTING METHODOLOGIES 187 sample mean followed a normal distribution. The p-values for fi xed effects were deter- mined using an Analysis of variance (ANOVA) of Type III Sums of Squares, with an adjustment to the denominator degrees of freedom using the Satterthwaite approxima- tion. To counteract the possibility of increased Type I Error due to multiple hypothesis tests, the maximum expected proportion of false discoveries among the rejected hypotheses for all pairwise tests was maintained at 5.0% using the Benjamini–Hochberg procedure. STATISTIC AL SOFTWARE The statistical software R (version 3.2.2 for Microsoft Windows R Foundation for Statistical Computing, Vienna, Austria) was used for all data analyses (18). In addition to the base package preinstalled with the software, the packages “ImerTest” (19) and “ggplot2” (20) were also used for linear mixed-effects model analysis and graphical plots, respectively. STATISTIC AL ASSUMPTIONS A linear mixed-effects model requires certain statistical assumptions concerning the data. Because both inference and point estimation/prediction were performed on the data, two major assumptions were tested: • Homosc edasticity–the population variance between each category/group was approximately equal. Although linear mixed-effects models do not require this assumption to determine point estimates or to predict effects, it is required if inference is made. Since ANOVA was performed and standard errors were calculated, testing of the equal-variance assumption was necessary. • Normal ity of the Residual Distribution–the distribution of the residual deviation between the observed values and the values predicted by the model was approximately normal. This applies to both the fi xed effects and the random effects. Major deviations will produce erroneous standard errors and confi dence intervals. For this reason, testing the normality of the residuals was performed. For mixed-effects models, if a violation to this assumption were to occur, a data transformation can be performed to mitigate the impact of the violation. However, mixed-effects models are robust against violations to this assumption, especially when the sample size is large. The diagn ostic tests indicated heteroscedasticity in the categorical predictors, particu- larly for the month in which an observation was evaluated (Levene’s Median Test, p = 7.335e-06). This was expected, as the sample sizes of the observations varied across dif- ferent months of the year, and homogeneity of the variance is a function of the sample size in a group. To investigate the magnitude of the equal-variance violation, box plots were produced for every categorical predictor. Upon further investigation, the box plots re- vealed that although heteroscedasticity was present, any violations to the homogeneity of the variance were minor in magnitude. In addition, as stated in the “Statistical Methods” section, the ANOVA of the data was conducted with an adjustment to the denominator degrees of freedom using the Satterthwaite approximation. This approximation is used whenever an assumption of equal variances cannot be made. Therefore, it can be argued that there was no adverse impact to the integrity of the statistical model, along with any inferences made from it.

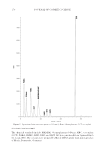
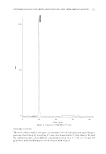
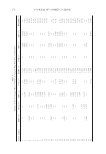
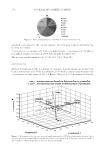
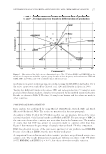
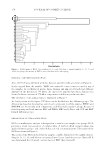
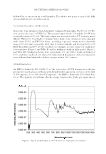
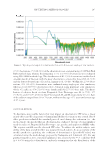
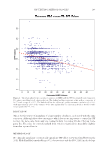
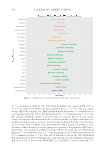
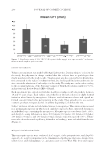
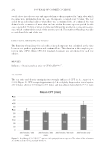
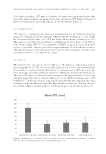
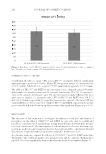
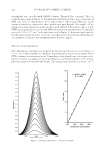
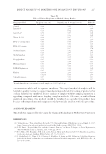
JOURNAL OF COSMETIC SCIENCE 188 Testing o f the residual distribution revealed deviations in the normality assumption, for both the fi xed effects and the random effects (Shapiro–Wilk’s W Test, p = 2.2e-16 and p = 1.306e-11, respectively). Visual inspection through quantile-quantile plots also re- vealed left and right skewness for both types of effects (i.e., fat tails), respectively. How- ever, it was determined that any violations to the normality assumption would also be minor in magnitude, mainly because of the large sample size of the dataset. In addition, Box-Cox Power Transformation Analysis was performed to determine if data transforma- tion would mitigate the violation, and the analysis did not provide any recommended transformation (maximum lambda value of 1.23, [95% CI: (1.15, 1.35)]). For these rea- sons, it can be argued that using the original data will not adversely impact the integrity of the statistical model. In additi on to testing the above assumptions, sensitivity analysis was performed to deter- mine the presence of collinear predictors, infl uential observations, and potential outliers in the data. The analyses concluded no presence of collinear predictors, no infl uential observations, and no presence of any potential outliers. As a result, all of the data were included in the analysis, and the statistical assumptions of the model were verifi ed. RESULTS T o determ ine how well the linear mixed-effects model predicted the data, a conditional coeffi cient of determination [(pseudo)-R2 value] was calculated. The (pseudo)-R2 value was calculated by incorporating the variance of both the fi xed and random effects in the model. The results indicated that the model accounted for approximately 23% of the variance in the data [Conditional (pseudo)-R2 = 0.227]. ANOVA o f the linear mixed-effects model revealed a statistically signifi cant impact on SPF values for P2 for time/month, the subject’s Fitzpatrick Skin Phototype, and the ob- servation’s unprotected MED value (p-values of 0.003, 0.026, and 2.2e-16, respectively). There was no statistically signifi cant effect when accounting for the methodology used, the type of solar simulator used, age of subject, or gender of subject (p-values of 0.068, 0.373, 0.126, and 0.657, respectively). Further e valuation of each observation’s unprotected MED value revealed a statistically signifi cant negative correlation with the resulting SPF value (Pearson’s product-moment correlation = -0.409, 95% CI: (-0.441, -0.376), p 2.2e-16). For every 10 mJ/cm2 in- crease in the unprotected MED, the predicted SPF value of an observation decreased by 1.55 [95% CI: (-1.70, -1.40)], when controlling for all other predictors. This linear trend can be seen in Figure 3. Estimated popu lation SPF values among each categorical predictor are presented in Figure 4. Observations evaluated in December yielded statistically signifi cant greater SPF values when compared with those observations evaluated from January, February, August, or September, with the greatest change in SPF values occurring between December and January [mean difference = -0.904, 95% CI: (-1.436, -0.371)]. Although the A NOVA indicated a statistically signifi cant impact for Fitzpatrick Skin Phototype (p = 0.026), pairwise comparisons revealed no statistically signifi cant differ- ences in mean SPF values among the three Skin Phototype groups. Pairwise comparison of Phototype I with Phototype II gave p = 0.994, of Phototype I with Phototype III gave p = 0.312, and Phototype II with Phototype III gave p = 0.069.
Purchased for the exclusive use of nofirst nolast (unknown)
From: SCC Media Library & Resource Center (library.scconline.org)