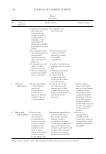
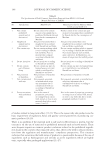
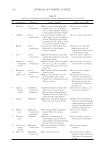
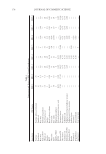
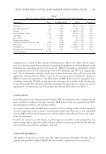
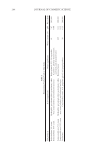
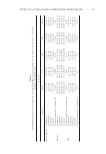
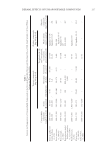
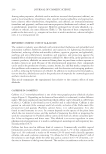
Table II Skin Biophysical Parameters for Commercial and Compounded Moisturizers Containing Urea 5% and Control Sites, after 1, 4, and 24 h as well as 1-Week Application Urea 5% Test site Before 1 h 4 h 24 h 1 week Sebum (μg/cm)2 Commercial 1.6 ± 0.54 4.46 ± 0.93 5.93 ± 1.71 3.53 ± 0.88 3.53 ± 0.70 Compounded 0.8 ± 0.61 7.06 ± 1.24 7.53 ± 2.08 2.66 ± 0.75 2.93 ± 0.79 Cream base 1.85 ± 1.01 6.93 ± 3.14 3.46 ± 0.87 2.66 ± 0.87 2.13 ± 1.08 Untreated 1.44 ± 0.95 1.12 ± 0.13 1.61 ± 0.55 1.84 ± 0.552 1.4 ± 0.64 p (compounded vs. commercial) 0.378 0.481 0.556 0.400 0.61 Friction Commercial 178.39 ± 75.54 449.78 ± 54.038 362.05 ± 172.02 288.76 ± 112.44 437.85 ± 206.33 Compounded 194.83 ± 94.04 408.63 ± 215.93 407.3 ± 219.27 358.66 ± 160.12 400.66 ± 243.40 Cream base 295.88 ± 173.01 387.30 ± 164.08 293.40 ± 86.68 310.33 ± 187.45 211.42 ± 35.90 Untreated 209.96 ± 186.21 177.63 ± 90.71 191.99 ± 116.636 245.02 ± 185.54 258.07 ± 135.66 p (compounded vs. commercial) 0.58 0.69 0. 15 0.369 0.244 pH Commercial 5.22 ± 0.31 6.32 ± 0.25 6.15 ± 0.23 6.38 ± 0.38 6.26 ± 0.45 Compounded 5.99 ± 0.51 6.27 ± 0.36 5.97 ± 0.45 6.12 ± 0.31 6 ± 0.31 Cream base 5.39 ± 0.56 5.65 ± 0.42 5.11 ± 0.40 5.26 ± 0.59 5.55 ± 0.50 Untreated 5.70 ± 0.42 5.61 ± 0.34 5.57 ± 0.27 5.63 ± 0.41 5.74 ± 0.33 p (compounded vs. commercial) 0.61 0.67 0.52 0.111 0.332 EFFECT OF A UREA-BASED COMPOUNDED MOISTURIZER 207

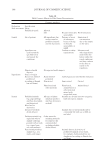
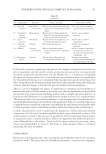
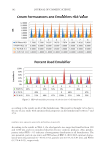
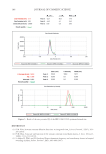
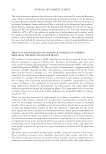
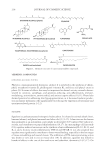
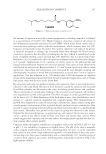
JOURNAL OF COSMETIC SCIENCE 208 points for both products (p-value for ANOVA with repeated measure 0.01). However, this increase in skin hydration was signifi cantly higher for commercial product 4 h after application (57.48 ± 11.23 vs. 50.59 ± 11.42, p-value = 0.02) (Figure 2A). Four hours after single a pplication as well as after 1 week of application, the commercial product decreased TEWL signifi cantly comparing with both control sites (p-value 0.01) (Figure 2B). However, in the case of the compounding product, TEWL reduction was signifi cant compared with the control sites just after the 1-week application. Four hours after single a pplication, TEWL was also considerably higher in the site of ap- plication of the compounded urea product than the commercial one (10.18 ± 1.65 g/m2.h vs. 9.46 ± 1.03, p-value = 0.04). A signifi cant increase in the ski n pH occurred after 1 week of application of both products, compared with both control sites (p-value 0.01). In this time point, the skin pH value was considerably higher at the site of application of compounded urea 10% product than com- mercial preparation however, it was not statistically signifi cant (p-value = 0.06) (Table III). Four and 24 h after single ap plication, the skin surface lipid content was signifi cantly higher at the site of compounding urea 10% preparation than the commercial one and untreated area (Table III). No signifi cant differences we re detected in friction coeffi cient between two groups in any of the measurement time points. However, until 24 h after single application, both prod- ucts led to signifi cant increase in friction coeffi cient compared with untreated area. Figure 2. Skin hydration (A) and TEWL (B) for commercial and compounded moisturizers containing urea 10%, after 1, 4, and 24 h as well as 1-week application (*signifi cant compared with cream-based formulation and untreated site, p 0.05) (#signifi cant compared with compounded product, p 0.05).
Purchased for the exclusive use of nofirst nolast (unknown)
From: SCC Media Library & Resource Center (library.scconline.org)