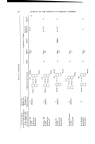
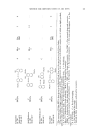
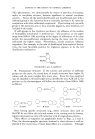
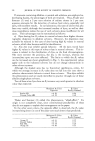
METHOD FOR IDENTIFICATION OF AZO DYES 225 6B, Rescrcine Yellow and others. Below is the position of the compounds seriously affected in a typical ammoniacal solvent: Solvent: R$ value expected according R$ value Butano]-Ethanol-Conc. NHa to the position in the really (5:3: 3) same neutral solvents obtained Carmoisine Approx. 0.40 0.07 Orange I " 0.75 0.47 Neptune Brown RX " 0.70 0.38 We have concluded that alkaline chromatographic fluids are very useful for specific separations (Systematic Method, Table 4) but unsuitable as general solvents, since the hydrophilic nature of some dyes may be severely affected. III. Atcidic Two-Phase Solvents. It has been reported that, in many instances, addition of organic acids to the aqueous phase of two-phase chromatographic solvents may improve the separation of spots. However, in the case of the dyes tested, the reported effect has been almost un- observable. The improved dispersion seen in the tested two-phase acid solvents was not enough to compensate for the frequent alteration of relative hydrophilic behavior of the dyes. Mineral acids, on the other hand, may cause formation of two solvent fronts ("demixing"), one of which includes and deforms the spots of many disulfonated dyes. For practical purposes, the use of this type of solvent has not been necessary under our conditions, since the special cases, that may be resolved with its aid, can also be handled with the aid of simpler and more manageable single-phase solvents. IV. 2•eutral Single-Phase Solvents. In our hands, dilute (1 or 2 per cent) solutions of organic or inorganic salts have been most useful. In concen- trated inorganic salt solutions, a noticeable decrease in Rs values is observed and, if organic substances are used, partition phenomena may occur. We have concluded that migration is governed by complicated variables. The more important ones are discussed below. A. Number and Position of Sulfonate Groups: Generally, the Rs values of the tested dyes increase with the degree of sulfonation. However, if these hydrophilic groups are in characteristic positions, the position of such groups is the most important factor in migration. It is known that sulfonic acid groups in the 3-position reduce the solu- bility of alpha and beta naphthol derivatives: OH --N:N• SOaNa OH SOaNa --N=N • 3-sulfo 2-azo 1-naphthol 3-sulfo 1-azo 2-naphthol

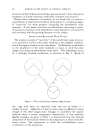
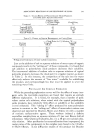
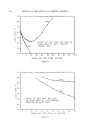
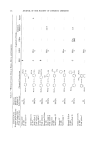
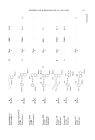
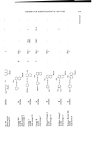
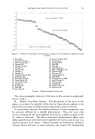
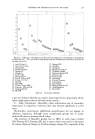
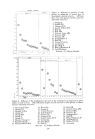
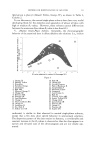
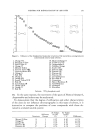
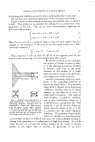
226 JOURNAL OF THE SOCIETY OF COSMETIC CHEMISTS This phenomenon, not demonstrable by means of partition chromatog- raphy in two-phase solvents, becomes significant in neutral one-phase systems. Almost all the tested disulfonated and trisulfonated dyes with a sulfonate group in the 3-position show a noticeable decrease in R• values by comparison with other sulfonated compounds. Dyes having only one sulfo group in the 3-position, are, in fact, insoluble pigments, and, therefore, not included in this study. If sulfo groups in the 3-position are absent, the influence of the number of hydrophilic substituents is predominant. The positions on the paper range from 0.00 to 1.00, according to the degree of sulfonation of the dyes tested, the monosulfonated compounds having the lower and the tetra- sulfonated the higher values. Nevertheless, certain positions influence migration: For example, in the case of disulfonated beta-naphthol deriva- tives, the most favorable position for migration appears to be the 6-8 disulfonate combination: OH -- N=N •, SOaNa SOaNa 6-8-disulfo 1-azo 2-naphthol B. Fundamental Structure: If the number and position of sulfonate groups are the same, the tested dyes of simple structures have higher Rs values, and the more complex dyes lower ones. Since the dyes examined may be classified in three principal series, identified by us as A, B and C, the position on the chromatogram will follow the direction (from 0.00 to 1.00) as follow•: --N:N---• series series • C series Dyes having specific structures (e.g., direct monoazo dyes such as Red FB) do not follow this rule and remain in the starting zone in chroma- tograms developed not only with saline but with all single-phase solvents. These effects on migration are graphically shown in Figs. 2, 3 and 4. Thus, the chromatographic spectrum obtained in these solvents is well ex- plained if the interactions of these three effects a•e considered. Although
Purchased for the exclusive use of nofirst nolast (unknown)
From: SCC Media Library & Resource Center (library.scconline.org)