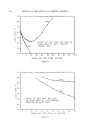
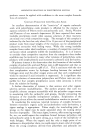
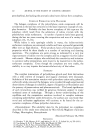
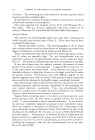
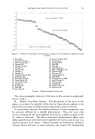
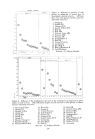
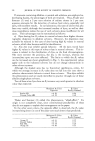
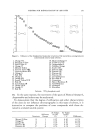
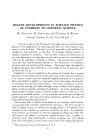
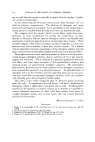
METHOD FOR IDENTIFICATION OF AZO DYES 231 lipid group is phenyl (Melanil Yellow, Orange IF), as shown in Table 3, Column 2. In our laboratory, the neutral single-phase solvents have been very useful developing fluids for the detection and separation of almost all dyes with high or medium Rs values. However, these solvents cannot differentiate between the numerous dyes whose Rr value is less than 0.15. V. /likaline Single-Phase Solvents. Generally, the chromatographic behavior of the examined dyes in dilute alkaline salt solutions (i.e., sodium o,i •o• o• 0,4 os oe o7 oB Rf value obtained in solvent 4 (See page 237) Figure 5 1. Orange IV 18. Red 6B 2. Metanil Yellow 19. Orange RN 3. Roccelline 20. Crystal Ponceau 4. Xylidine Orange 21. Benzyl Bordeaux B 5. Carmoisine 22. Azogrenadine S 6. Red 10B 23. Resorcine Yellow 7. Monosol Orange O 24. Amaranth 8. Orange III 25. Acid Yellow G 9. Ponceau MX 26. Red 2G 10. Ponceau 3R 27. Victoria Violet 4BS 11. Acid Bordeaux 28. Sunset Yellow FCF 12. Orange I 29. Orange GGN 13. Neptune Brown RX 30. Lanafuchsin 6B 14. Orange II 31. Ponceau 4R 15. Anthosine B 32. Orange G 16. Fast Red E 33. Ponceau 6R 17. Yellow 27.175N 34. Scarlet GN carbonate) is similar to that observed in neutral single-phase solvents, except that a few dyes show special behavior in ammoniacal solutions. The dispersion pattern of the dyes retains its features a considerable and constant increase in the Rr values is observed so that the dyes appear in a narrow and elevated zone of the chromatogram and are not clearly sep- arated.

232 JOURNAL OF THE SOCIETY OF COSMETIC CHEMISTS If ammonia containing alkaline or neutral salt solutions are employed as developing liquids, the advantages of both are retained. Thus, Thaler and Sommer (3) used a 2 per cent solution of sodium citrate in $ per cent aqueous ammonia for the detection of various food colors, especially red dyes, with excellent results. In our laboratory, this type of solvent has also been very useful, although the increased number of dyes, as well as their close resemblance makes the use of such solvents alone insufficient for all cases. Their advantages may be summarized as follows: a) Dyes having low Rs values in neutral solvents show higher chroma- tographic dispersion in alkaline solvents. However, the dispersion may actually be reduced in the case of dyes having high Rs values in neutral solvents, which then become useful for identification. b) Any dye may exhibit special behavior. All the dyes tested have higher Rs values in this type of solvent than in neutral solvents. This in- crease is related to the distribution of dyes on the final chromatograms. The more extreme the positions, the less is the increase, whereas the intermediate spots are more affected. The limits to which the Rs values can be increased are shown graphically in Fig. 5 the experimental values apply only to the indicated solvents but do not change substantially in other solvent systems. Although the shaded area has no theoretical significance, colors, for which the average increase in Rs value does not fall into this zone show a selective characteristic behavior toward these solvents. Nine dyes exhibit this phenomenon and are easily identified in practice through use of these alkaline single-phase solvents. Two of these nine dyes show an Rf increase very much greater in absolute value than expected: Maximum RS Value Rs Value Expected Really Obtained Scarlet GN •0.50 0.96 Victoria Violet 4BS •0.58 0.68 Thaler and Sommer (3) called this phenomenon, "alkali-effect." Its origin is not completely clear, since constitutional peculiarities of these dyes do not appear to explain their arrangement on the paper. In the other seven colors, the opposite effect is observed, the Rf value increase being lower (in one of the cases very much lower) than predicted: Minimum R• Value R/Value Expected Really Obtained Orange IV =0.16 0.12 Metanil Yellow -•0.19 0.15 Red 10B = 0.34 0.29 Orange III = 0.40 0.33
Purchased for the exclusive use of nofirst nolast (unknown)
From: SCC Media Library & Resource Center (library.scconline.org)