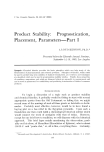
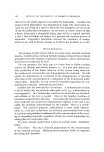
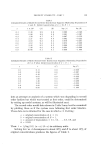
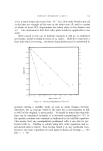
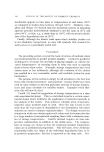
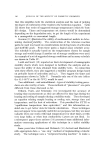
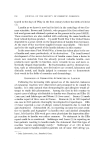
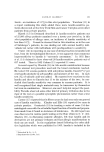
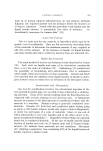
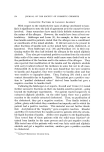
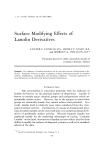
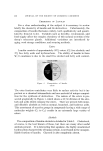
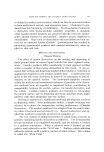
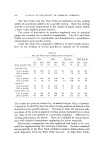
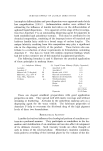
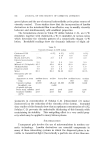
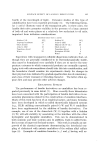
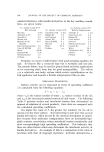
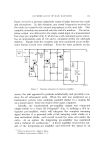
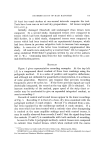
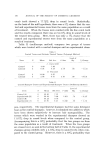
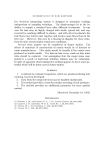
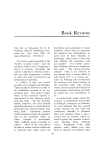
140 JOURNAL OF THE SOCIETY OF COSMETIC CHEMISTS Figure 1 shows the data of Table I graphically. It can be seen that in the case of "A," a first order plot exhibits considerable curvature after about 4% degradation has taken place. This is not too good from the point of view of needing a straight line relationship. However, this case, in which the original concentration of A = 10 and its nemesis, so 1.000 O, 995 O. 990 0.985 • o.98o o. 975 0.970 0.965 0.960 0 i • i i ! 61 i i i , i 2 3 • 5 7 b 9 lo T•me x 10 2 Figure 1. Percent Degradation of A o 9 to speak, is B which initially existed at a concentration 10% of that of A, leads to some comfort in two respects: First, it is more likely that a significant nemesis would have a higher concentration, and secondly, the degradation of A will stop after 10% decomposition from a "10% nemesis." Additional second order model data shown in Table II illustrate some different aspects of this situation. These data were obtained for the case in which a = b by letting: a = original concentration of C = 1, x = amount of degradation = 0.1, 0.2 .... ,0.8, 0.9, and k=l. Then: t = x/a(a--x) in arbitrary units. Solving for t as C decomposes to about 10% of its original concentra- tion produces the figures of Table II. Figure 2 illustrates the data of Table II. It is apparent that when the original A is attacked by "someone its own size" (line "C," a -- b)

PRODUCT STABILITY--PART I 141 or by a much larger adversary (line "B," 10x), first order kinetics prevail as the lines are straight all the way in the latter case (B) and to a point at which at least 50% degradation has taken place in the former case (C). Our conclusion is that first order plots should be applicable to our work. With regard to the use of half-life concepts it will be, as indicated previously, useful to think in terms of too values. Half-lives represent a time unit which is too long obviously degradation must be monitored in -0.1 -0.2 -0.3 -0.6 -0.7 -0.8 -0.9 • 5 7 Time or Time x 102 Figure 2. Percent Degradation of B or C c 1c 20 30 •$o 5o 7o 8o ! 9 products during a stability study as soon as small changes develop. Therefore, the t90 concept, which is the time for a concentration to fall to 90% of the original, is most useful. It should be noted also that this time can be correlated (actually, it is inversely proportional to "k") to the specific reaction rate constant as indicated in the half-life equation. This means that any manipulation performed with k can also be per- formed with too. Finding too entails using first order equations and ex- perimental data to find k then having found k at any particular tem- perature, the same equations are used again to find too by setting co = 100 and c = 90.
Purchased for the exclusive use of nofirst nolast (unknown)
From: SCC Media Library & Resource Center (library.scconline.org)