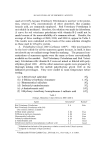
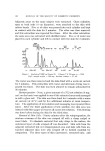
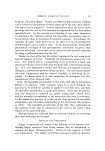
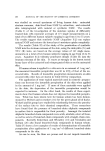
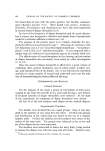
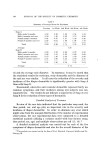
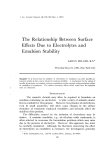
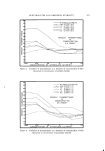
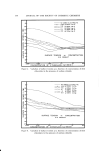
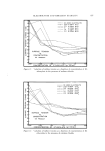
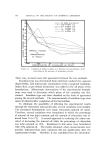
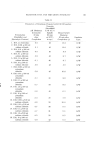
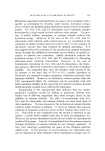
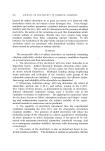
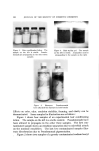
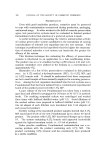
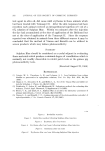
ELECTROLYTES AND EMULSION STABILITY 171 50 g of each completed formulation were placed in several glass vials and immediately sealed. Measurements Subjective observations and objective parameter measurements were conducted on material obtained from these vials. Particle size determinations of approximately 500 emulsion droplets, the oil phase of which was stained by Sudan Red, were carried out by means of a micro- scope equipped with a stage micrometer. The measurements were con- ducted, wherever sufficient emulsion stability permitted, 30 minutes after the emulsion had reached ambient (25 + 1 øC) temperature. pH measurements were made with a Beckman Zeromatic pH meter immediately after complete cooling of the formulation and also 24 hours later. Critical micelle concentration (C.M.C.) data of individual ethoxy- lates and of ethoxylate-electrolyte combinations were obtained on aqueous solutions of individual ethoxylates and ethoxylate-electrolyte combinations. The individual ethoxylate was added in exponentially increasing concentration to deionized water. In the case of ethoxylate- electrolyte combinations, the exponential dilutions were carried out in aqueous solutions with deionized water containing the proper concentra- tion of electrolyte. This procedure was repeated with several electrolyte concentrations to assess the effect on the C.M.C. Exactly 0.1 ml of a 0.5% aqueous dye solution, Benzopurpurin 4B (a biological stain from Matheson, Coleman and Bell), was then added to 100 ml aliquots of each of the solutions. The transmittance of these solutions was mea- sured on a Bausch & Lomb Spectronic 20 at 540 mu. A curve for each ethoxylate (where sufficient solution clarity permitted) and ethoxylate- electrolyte combination was plotted (Figs. 1-4). A sharp change in the slope of the curve over a narrow ethoxylate concentration was observed. This variance, in accordance with the experimental results of Becher and Schmolka and Raymond, can be assumed to occur at the C.M.C. (4, 5). Surface tension studies were made with the DuNouy tensiometer. Aqueous solutions, consisting of exponential dilutions of individua[ ethoxylates and ethoxylate-electrolyte combinations prepared in a manner similar to that used for the C.M.C. studies, were utilized in determining surface tensions (Figs. 5-13). Moreover, the results from the tensiometer were compared to the C.M.C. data obtained with the dye to determine agreement of the methods in the presence of electrolyte.

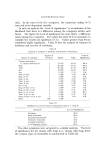
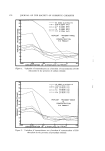
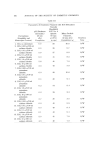
172 JOURNAL OF THE SOCIETY OF COSMETIC CHEMISTS 65 '{ 60 - -- NO ADDED ELECTROLYTE •'x,• --•-- 0.001 g/lOOml, No CI 55 . --•-- 0.01 g/IOOml. No CI --,-- 0.1 g/lOOml. NoCI •50 . --o-- 1,0 g/lOOml. NoCI Z I--x-- I0.0 g/IOOml, No CI I- •'"'ø • PERCENT TRANSMITTANCE •: 40 - (/) o + VS, I-- 30 - •0 . 5" o I I I o.ooo• o.oo• o.o• o, • •,o ' •o,o CONCENTRATION OF ETHOXYLATE (g/lOOml) Figure 1. Variation of transmittance as a function of concentration of El0 ethoxylate in the presence of sodium chloride 6. ß 60- -- NO ADDED ELECTROLYTE --•-- 0,001 g/lOOml. K CI 55 --•,-- 0,01 g/I00 mi. K CI •'•'-•-• 0.1 g/ I00 mi. K CI _ _ • o-- 1,0 g/lOOml. K CI 50 .....-.---"'"• • --x-- IO.O g/ 100 mi. K CI • ,•o ß PERCENT TRANSMITTANCE \ vs, • 30 CONCENTRATION - E,O 'ROOUC'r I0' 5' ol I I I ] o.oool o.oo• o,o• o.• •.o •o.c CONCENTRATION OF ETHOXYLATE (g/lOOml) Figure 2. Variation of transmittance as a function of concentration of El0 ethoxylate in the presence of potassium chloride
Purchased for the exclusive use of nofirst nolast (unknown)
From: SCC Media Library & Resource Center (library.scconline.org)