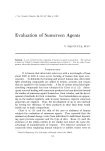
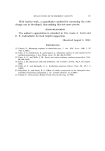
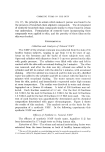
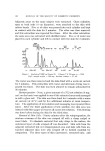
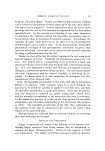
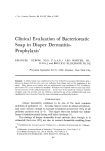
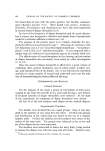
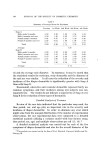
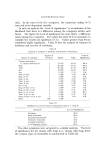
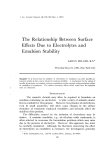
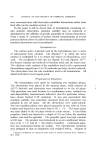
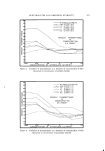
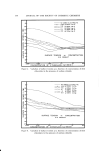
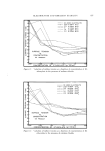
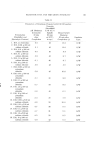
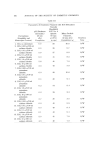
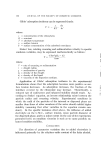
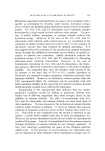
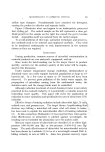
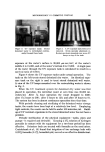
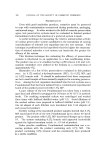
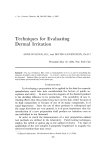
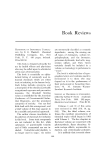
ELECTROLYTES AND EMULSION STABILITY 59 NO ADDED ElECTROlYTE \\ •. --©-- 0.001 g/lOOml. Na Cl • 57- • • --8-- 0.01 g/IOOml, Na CI •,• .,A, • --'-- 0.1 g/lOOml. NaCI 0 55 . '• ./ • • --o--1.0 g/lOOmi. No CI •' _NN.N• • --x-- 10.0 g/100ml. Nn CI •_1 53- 03 47 - z I- 45 o43 SURFACE *ES10N [Z: 41 VS. o') CONCENTRATION 39 E5 PRODUCT 37 35] I I I I o.oool o.ool o.o• o. i •.o io'.• CONCENTRATION OF ETHOXYLATE (g/lOOml) 177 Figure 11. Variation of surface tension as a function of concentration of Eb ethoxylate in the presence of sodium chloride 61 59 .'- NO ADDED ELECTROLYTE • --(•-- 0.001 g/lOOml. Co CI 2 •57 • \ _ --•-- 0.01 g/lOOml. CoCI2 •x.•..•• --.-- 0., g/lOOm,. CnClt 55-• / \• --o-- 1.0 g/lOOml. CaCl• •' •/ • .... '0.0 ,/,00m,. Ca C,, Z - SURFACE TENSION • 41 - VS. D CONCENTRATION E5 PRODUCT 35 I I I I 0.0•1 0,001 0.01 O. I 1,0 iO,C CONCENTRATION OF ETHOXYLATE (g/lOOml) Figure 12. Variation of surface tension as a function of concentration of Eb ethoxylate in the presence of calcium chloride

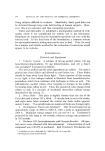
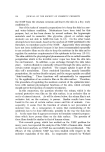
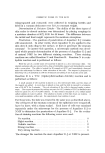
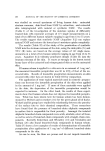
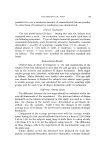
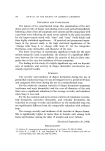
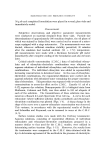
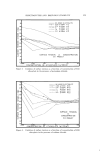
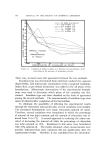
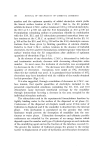
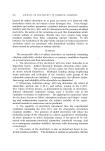
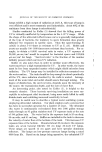
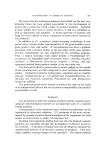
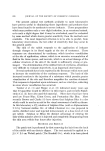
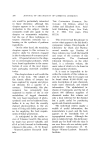
178 JOURNAL OF THE SOCIETY OF COSMETIC CHEMISTS 61 • NO ADDED ELECTROLYTE 59 •'• --•-- O.00l g/lOOml. K CI 57 -•,, -- -- 0.01 g/lOOrnl. K CI -.- o., //• --o-- 1.0 g/lOOml. K CI C.) •,",•/ • --x-- '0.0 g/lOOm,. K C, . 51 ••x • 49 o_ 47 •b_. 43' TENSION •• •••. 41 - VS.
SURFACE rr CONCENTRATION g 3• - E5 PRODUCT $? - 35 I I I • •o.ooo• o.ool o.o• o. • •.o •o.o CONCENTRATION OF ETHOXYLATE (g/ IOOml ) Figure 13. Variation of surface tension as a function of concentration of E5 ethoxylate in the presence of potassium chloride There was, in most cases, fair agreement between the two methods. Emulsion type was determined from electrical conductivity, aqueous dispersibility, and microscopic examination of the completed emulsions. Sudan Red, as previously mentioned, was added to the oil phase of the formulations. Microscopic observations of the experimental formula- tions were used to determine which phase of the emulsion was dye- stained. Emulsion type was then classified on the basis of agreement among the several methods. The measurements of emulsion type were taken 30 minutes after completion of the formulation. To eliminate the possibility of affecting the experimental results through the ethoxylate mineral oil ratio, several variations were studied. The presented formulations have large ethoxylate/mineral oil ratios. Therefore, several emulsions were formulated in which the percentage of mineral oil was kept constant and the amount of ethoxylate was re- duced from 10 to 7%. A second approach to reducing the ratios con- sisted of increasing the mineral oil while the percentage of ethoxylate was held constant at 10%. Emulsions in this series were formulated with 10% mineral oil. The results obtained, where measurements were possible, indicated that ratio variations did not significantly alter the experimental results. Therefore, it was concluded that the electrolyte-
Purchased for the exclusive use of nofirst nolast (unknown)
From: SCC Media Library & Resource Center (library.scconline.org)