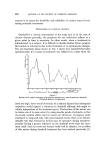
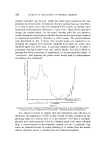
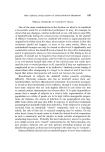
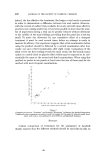
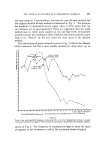
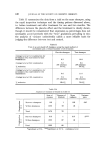
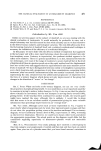
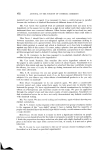
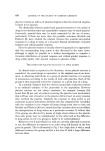
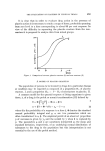
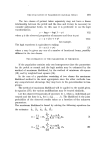
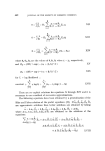
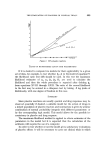
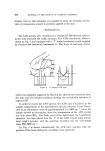
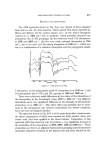
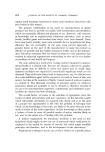
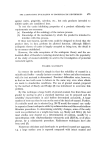
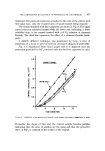
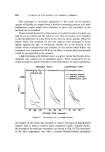
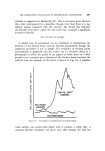
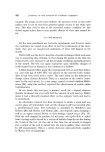
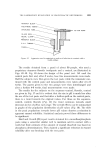
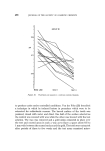
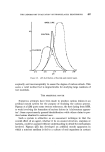
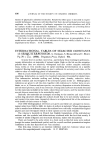
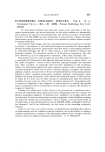
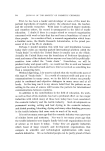
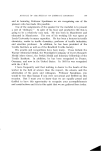
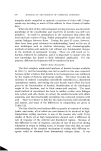
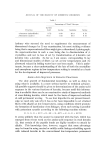
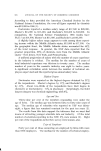
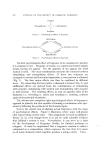
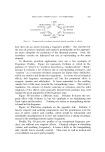
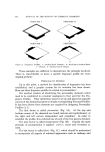
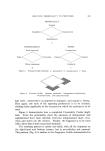
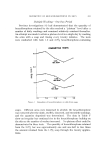
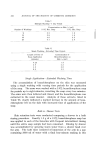
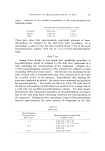
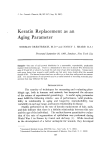
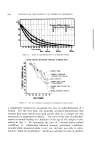
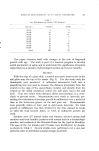
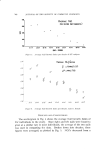
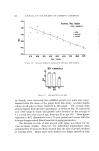
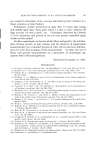
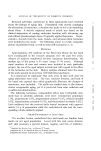
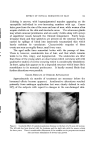
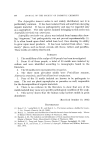
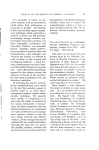
464 JOURNAL OF THE SOCIETY OF COSMETIC CHEMISTS obtained graphically from an arithmetic probability plot of the observed responses. The case of fifty per cent reactors with the two groups differing only in the value of a which is sufficient to clearly separate the groups is given in Fig. 2. It can be seen that the curve for the mixed groups tends to the first line for low dosage and to the second for high dosage. Fig. 3 illustrates the behaviour when the two groups are not so clearly separated ,•o ' ' ' i. ' • Figu•'e 2 50% placebo reactors. and where the values of [I are different• In this case also the mixture curve tends to the separate groups at the extreme values of the dosage. The initial values for a•, a 2, [31, •2 may be obtained by drawing lines through the points on the A.P. plot at the ends of the range of dosage and these values used with an intermediate point to estimate II•. It is advisable to take a• • a2 and [l• • 132 since otherwise equations XVIIl through XXII become identical with the equations for fitting a single straight line to the A.P. plot and the above method is liable to converge to the wrong solutions. When the observed responses are plotted the points will be scattered about the population curve and straight lines should be drawn so that the points lie close and slightly below line II and above line I.

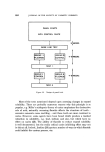
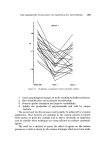
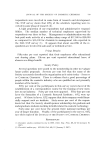
THE EVALUATION OF PLACEBOS IN CLINICAL TRIALS 465 -& Figure 3 33% placebo reactors. TESTS OF HYPOTHESES ABOUT THE PARAMETERS If it is desired to compare two models for their applicability to a given set of data, for example, to test whether •---0 in the model of equation IV the likelihood ratio test (15) should be used. In this test the maximum likelihood estimates of a•, a2, [11, [12, YI1 are used to calculate the likelihood and then the whole procedure is repeated after deleting • from equations XVIII through XXII. The ratio of the second likelihood to the first may be entered in a chisquare test by taking -2 log (ratio of likelihoods), with one degree of freedom in this case. SUMMARY Since placebo reactions are usually quantal and drug responses may be observed quantally if desired, a suitable model for the action of drugs in a mixed population of placebo reactors and nonreactors is given by a linear combination of normal probability integrals with different parameters or by the corresponding logit model. This model allows for the possible in- consistency in placebo and drug response. The maximum likelihood method is applied to obtain estimates of the parameters in the model but it is expected that the calculation of the estimates will require the use of a computer. In order to test whether or not the model gives satisfactory evaluations of placebo effects it will be necessary to carry out clinical trials in which
Purchased for the exclusive use of nofirst nolast (unknown)
From: SCC Media Library & Resource Center (library.scconline.org)