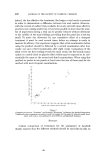
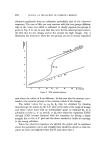
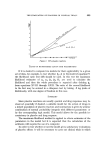
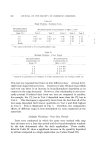
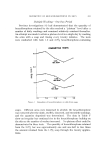
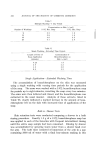
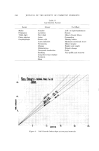
466 JOURNAL OF THE SOCIETY OF COSMETIC CHEMISTS several dose levels of each drug are administered in place of the customary trials in which each drug is used at only one or two levels. ACKNOWLEDGEMENT I should like to thank Mr. N.J. Van Abb•, F.P.S. of Beecham Toiletry Division, for directing my attention to the problem of evaluating placebo reactions. (Received: 16th August 1966) REFERENCES (1) Hill, A. B. Brit. Med. J. 1 1043 (1965). (2) Lasagna, L. Sci. Amer. 198 68 (1955). (3) Gaddum, J. H. Proc. R. Soc. Med. 4?. 195 (1954). (4) Parkhouse, J. Proc. R. Soc. Med. õ?. 67 (1964). (5) Wolf, S. et al J. Allergy 9,1. 1 (1950). (6) Chambers, W. T. Rubber Technology Conference (1948). (7) Hill, A. B. Statistical Methods in Clinical and Preventive Medicine (1962) (Livingstone, Edinburgh) (8) Cox, D. R. Planning of Experiments (1958) (Wiley, New York) (9) Hewlett, P.S. and Plackett, R. L. Biometrics 1 •.. 72 (1958). (10) Lasagna, L. et al. Amer. J. Med. 16. 770 (1954). (11) Berkson, J. Biometrics, 7. 327 (1951). (12) Finney, D. J. Probit Analysis (1952) (University Press, Cambridge). (13) Cramer, H. Mathematical Methods of Statistics (1945) (University Press, Princeton). (14) Berkson, J. J. Amer. Statist.'Ass. õ0. 130, 529 (1955). (15) Kendall, M. G. and Stuart, A. The Advanced Theory of Statistics 9.. (1961) (Griffin, London). Introduction by the lecturer If the two populations are not sufficiently separated it may be difficult to distinguish between the curve for the mixed population and the corresponding straight line approximation in view of the random fluctuations which will occur. However, there is less practical importance in the separation into two groups for this case since a straight line approximation will give results which are very similar to the hypothetical curve. For example, if ai = 0, a2 =-2, [•l = [•2 = 1, and nl = «, then the following results are obtained by means of a straight line approximation drawn by eye. x -1 0 1 2 percent exact 8.0 26.1 50.0 73.9 -- response approx. 9.0 24.8 50.0 75.0 The conclusion is that, for a mixture of two distinct groups of reactors and non- reactors with only a small difference in their reaction to drugs, it is still possible to fit the data and obtain satisfactory results.

THE EVALUATION OF PLACEBOS IN CLINICAL TRIALS 467 One characteristic of most clinical trials on placebo reaction in the past is the use of only two, or at most three, dose levels including zero. Inherent in the proposed method is the use of sufficient points in the effective dose range to determine the shape of the curve. The increase in the amount of information from a clinical trial is dependent on a considerable increase in expenditure. At the moment, a student at Brunel University is writing a programme for this method and also to simulate some data, because one of the things when you introduce a new model is to find out whether it works reasonably in terms of the assumptions. Then you can apply it to real data to determine whether the assumptions hold in practice. DISCUSSION MR. N.J. VaN ABBg: Since a range of dose levels, as such, is not normally applic- able to cosmetics and toiletries, would it be correct to interpret your model in terms of either (a) a range of concentrations of active constituent in the base, or (b) a range of increasing time intervals for observation? THE L•CTURER: Although I have spoken primarily in terms of drug action, I am really concerned with medicaments and X does not have to be interpreted as the dose the normal procedure is to use a so-called dose metameter which is often the logarithm of a dose because it so happens that in the majority of situations one gets closer to a straight line on A.P. paper if the log of the dose rather than the dose itself is plotted. X only denotes some characteristic which, when it varies, •vill produce a variation in the probability of response and it can be the duration of treatment, or the concentration in some base, or both. I suspect that the random fluctuations would be much too large to make much use of a model with several such variables but there is no objection in principle. Instead of X we could use concentration and ti•ne of treatment as two variables, providing, of course, that we have a consistent way of determining successes. If we have prolonged treatment then we have to look at its success or failure at the end rather than at stages. Otherwise it is necessary to use sequential analysis and I believe that this was discussed at a previous meeting. There is no attempt in my model to introduce sequential ideas. DR. I•. H. R. WRItliT: Why is there a difference betxveen •i 1 and B27 TH• LECTURER: I based this more or less on a desire to be as general as possible and the most general case would be that the two betas are different. In one paper in the literature it was pointed out that it appeared that placebo reactors did respond differently with respect to the level of dose, but there is nothing to say that one can not restrict the model to equal betas, Another way in which one can restrict the model is to assume that the placebo reactors do not react to the drug at all, in which case we will put B1 equal to zero. All these things are possible and the equations can be modified accordingly. I have suggested that one can formally make this a matter of statistical test as to whether •-----•i2 or whether one of them is zero. I think that we want some experience with the method before we get too sophisticated. It might be a good idea to start off with •i•=•i2. We are just trying to carry out some clinical trials, observe the proportion of responses and match it by means of a model so that for different values of dose we can predict the response in the general population. Any model which fits our data well can be used for this, irrespective of whether it reflects some underlying physiological or pharmacological action. You can certainly make •i1=•2, particularly if there is some justification for doing so.
Purchased for the exclusive use of nofirst nolast (unknown)
From: SCC Media Library & Resource Center (library.scconline.org)