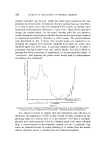
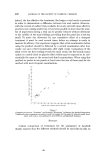
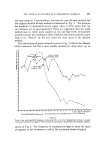
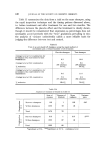
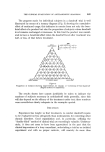
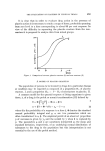
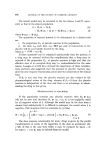
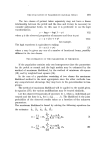
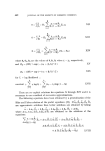
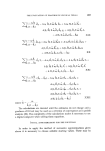
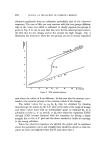
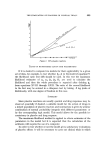
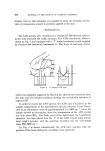
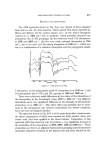
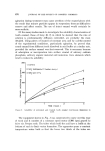
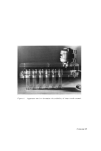
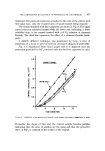
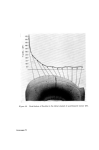
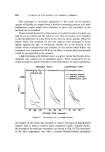
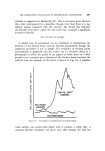
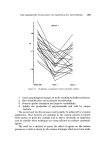
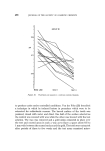
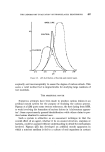
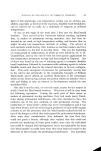
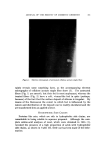
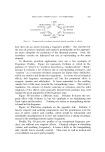
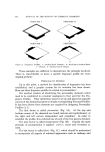
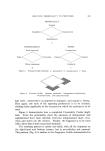
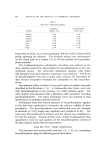
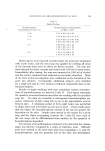
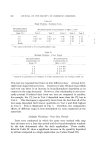
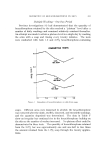
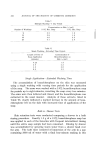
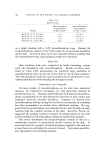
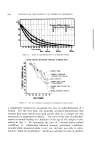
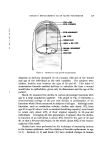
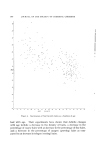
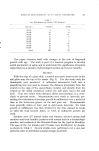
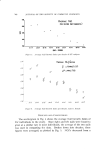
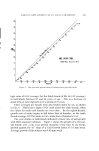
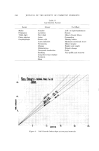
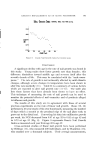
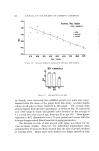
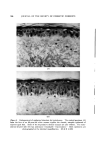
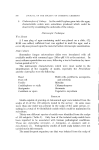
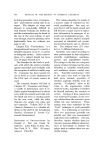
THE EVALUATION OF PLACEBOS IN CLINICAL TRIALS 465 -& Figure 3 33% placebo reactors. TESTS OF HYPOTHESES ABOUT THE PARAMETERS If it is desired to compare two models for their applicability to a given set of data, for example, to test whether •---0 in the model of equation IV the likelihood ratio test (15) should be used. In this test the maximum likelihood estimates of a•, a2, [11, [12, YI1 are used to calculate the likelihood and then the whole procedure is repeated after deleting • from equations XVIII through XXII. The ratio of the second likelihood to the first may be entered in a chisquare test by taking -2 log (ratio of likelihoods), with one degree of freedom in this case. SUMMARY Since placebo reactions are usually quantal and drug responses may be observed quantally if desired, a suitable model for the action of drugs in a mixed population of placebo reactors and nonreactors is given by a linear combination of normal probability integrals with different parameters or by the corresponding logit model. This model allows for the possible in- consistency in placebo and drug response. The maximum likelihood method is applied to obtain estimates of the parameters in the model but it is expected that the calculation of the estimates will require the use of a computer. In order to test whether or not the model gives satisfactory evaluations of placebo effects it will be necessary to carry out clinical trials in which

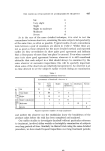
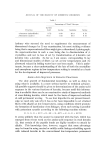
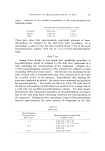
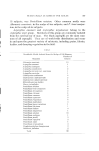
466 JOURNAL OF THE SOCIETY OF COSMETIC CHEMISTS several dose levels of each drug are administered in place of the customary trials in which each drug is used at only one or two levels. ACKNOWLEDGEMENT I should like to thank Mr. N.J. Van Abb•, F.P.S. of Beecham Toiletry Division, for directing my attention to the problem of evaluating placebo reactions. (Received: 16th August 1966) REFERENCES (1) Hill, A. B. Brit. Med. J. 1 1043 (1965). (2) Lasagna, L. Sci. Amer. 198 68 (1955). (3) Gaddum, J. H. Proc. R. Soc. Med. 4?. 195 (1954). (4) Parkhouse, J. Proc. R. Soc. Med. õ?. 67 (1964). (5) Wolf, S. et al J. Allergy 9,1. 1 (1950). (6) Chambers, W. T. Rubber Technology Conference (1948). (7) Hill, A. B. Statistical Methods in Clinical and Preventive Medicine (1962) (Livingstone, Edinburgh) (8) Cox, D. R. Planning of Experiments (1958) (Wiley, New York) (9) Hewlett, P.S. and Plackett, R. L. Biometrics 1 •.. 72 (1958). (10) Lasagna, L. et al. Amer. J. Med. 16. 770 (1954). (11) Berkson, J. Biometrics, 7. 327 (1951). (12) Finney, D. J. Probit Analysis (1952) (University Press, Cambridge). (13) Cramer, H. Mathematical Methods of Statistics (1945) (University Press, Princeton). (14) Berkson, J. J. Amer. Statist.'Ass. õ0. 130, 529 (1955). (15) Kendall, M. G. and Stuart, A. The Advanced Theory of Statistics 9.. (1961) (Griffin, London). Introduction by the lecturer If the two populations are not sufficiently separated it may be difficult to distinguish between the curve for the mixed population and the corresponding straight line approximation in view of the random fluctuations which will occur. However, there is less practical importance in the separation into two groups for this case since a straight line approximation will give results which are very similar to the hypothetical curve. For example, if ai = 0, a2 =-2, [•l = [•2 = 1, and nl = «, then the following results are obtained by means of a straight line approximation drawn by eye. x -1 0 1 2 percent exact 8.0 26.1 50.0 73.9 -- response approx. 9.0 24.8 50.0 75.0 The conclusion is that, for a mixture of two distinct groups of reactors and non- reactors with only a small difference in their reaction to drugs, it is still possible to fit the data and obtain satisfactory results.
Purchased for the exclusive use of nofirst nolast (unknown)
From: SCC Media Library & Resource Center (library.scconline.org)