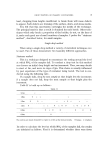
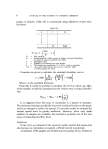
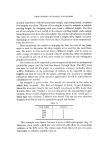
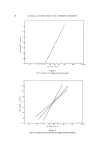
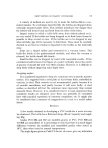
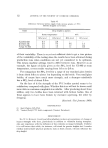
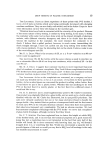
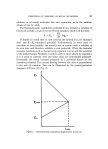
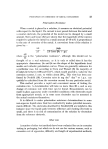
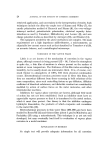
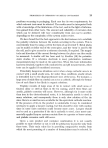
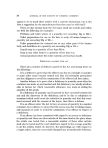
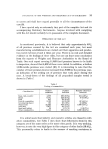
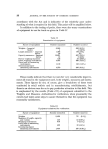
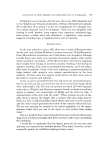
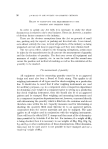
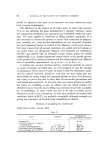
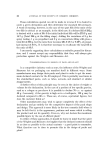
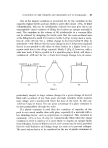
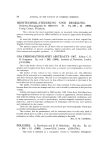
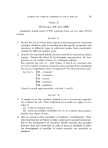
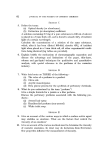
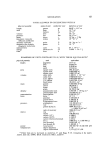
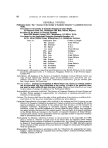
DROP TESTING OF PLASTIC CONTAINERS no prior experience with the particular sample type being tested, a further five samples are taken. This set of five samples is used to estimate a suitable starting height, by dropping each once from a different height. The first set of ten samples is now tested at the chosen starting height, each sample being dropped once from the same height. The number of failures is recorded. The next set of ten is now dropped from a height 25% higher or lower, depending on whether there were less than $ failures or more respectively, from the first ten. After examining the results of dropping the first two sets of ten, judg- ment is used to determine the drop heights to be used for the next three sets. The aim is to drop each set from a different height, and to cover as wide a range of heights as is possible without producing either ten failures or ten passes in any set of ten such results are useless for the subsequent graphical treatment. The results are now expressed as percentages and plotted on arithmetical probability paper, and the best line drawn through them. The 50ø/0 level can now be read off the graph to a moderate accuracy, probably about +10%. Estimates of the percentage of failures to be expected at other heights can also be read off the graph, although the accuracy is steadily reduced as either end of the spread is approached. It will be noted that no calculations are needed. An example is given below. The results are recorded in the order in which they occurred. The first set dropped at 2.4 m. It gave t3 failures. Since this was more than 5, the next height was chosen as 25ø/0 lower than the first. Since only 3 failed, a set was dropped at the intermediate height of 2.1m. These results suggested that dropping from 2.7m would give a fairly high rate of failure 7 failures were found. The last set were therefore dropped from 3m in order to spread the graph out further. Drop height 2.4m 1 .Sin 2.1m 2.7m 3ra Table IV Failures This example was chosen because it gave a fairly good graph (Fig. 1). However, even results which are very scattered still allow of a reasonable estimate of the 50% level. The values away from this level are, of course, impossible to estimate sensibly (Fig. 2).

JOURNAL OF THE SOCIETY OF COSMETIC CHEMISTS 3.3 3-0 2.7 2'4 o 0-1 I 2 5 10 30 50 70 90 98 Per cent failure Figure 1 PVC bottles: 10 dropped at each height. 99 99 3'0 2'7 u* 2'4 E 2'1 .? 121 1',5 1'2 0'9 O. I 2 I0 $0 50 70 90 98 Per cent failure Figure 2 Effect of different lines drawn through scattered results 99.99
Purchased for the exclusive use of nofirst nolast (unknown)
From: SCC Media Library & Resource Center (library.scconline.org)