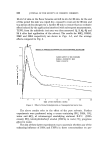
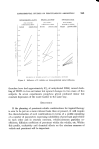
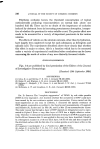
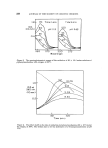
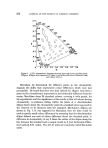
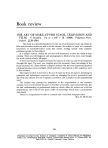
INSTRUMENTAL COLOUR MEASUREMENT AND CONTROL 273 A convenient graphical method for colour difference determination was devised by Simon and Goodwin (2) and is based on MacAdam's data. They proposed that 89 ellipses covering defined regions of the C.I.E. diagram were sufficient for colour difference work and prepared special charts which transformed the C.I.E. diagram such that the discrimination limits plotted as circles of equal radius. A further set of 13 charts was prepared to enable chromaticity differences to be corrected for lightness and to enable lightness differences to be expressed in J.N.D. units. When a sample, or series of samples, is to be assessed against a control, a colorimeter measurement is made on each pattern. X, Y, Z values for the control and the samples, obtained either directly from the colorimeter or by conversion of instrument readings, are recorded and the chromaticity co- ordinates (x.y) are calculated. The appropriate Simon and Goodwin chromaticity chart is selected and the chromaticity points are plotted. A direct measure of the chromaticity difference between sample and control is obtained from the distance between the chromaticity points. This distance is measured and its value recorded on the appropriate chart from the second set of 13. The lightness or Y values are recorded also and three quantities the lightness difference, the chromaticity difference and the overall colour difference which includes both the lightness and chromaticity differences, are displayed. A tolerance limit such as is shown by the semi-circle in Fig. • may be superimposed indicating that the sample plotted is outside tolerance. DARKER Figure 2. CHROMATICITY DIFFERENCE /• SAMPLE / / LENGTH EQUALS OVERALL "-'•""•/•/CO L 0 IJ R DIFFERENCE // TOLERANCE LIMIT / • LIGHTER COI'ITROL L iGHTI'!E$S DIFFERENCE Simon and Goodwin colour difference calculating chart The Colour Analysis Display Computer uses the MacAdam ellipse data and when fed with colorimeter readings automatically displays colour

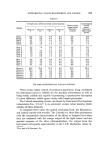
274 JOURNAL OF THE SOCIETY OF COSMETIC CHEMISTS difference. Purchase of such an instrument thereby removes the graphical plotting procedure and speeds up the process considerably. Speed is of con- siderable importance when the number of samples to be assessed is large. An alternative procedure in the calculation of colour differences is the use of a colour difference formula (3). There are many such formulae in existence and it is not clear at present which one gives best correlation with the human eye over all colour space. Four formulae which have been recommended for field trials by the C.I.E. are: The 1964 C.I.E. formula (4), the Cube Root formula (5), the Munsell Renotation formula (6) and the MacAdam-Modified Friele Formula {7). None of these formulae appear to show advantage over the Simon and Goodwin chart method but may be more convenient to use if a digital computer is available. PRACTICAL EXAMPLE OF THE USE OF SIMON AND GOODWIN CHARTS IN THE ASSESSMENT OF PAPER SAMPLES Four standard colours, a red, a grey, a blue and a brown, were assessed visually against a number of similar coloured samples by four experienced colour matchers. The average overall colour differences between each sample and standard were determined from the individual visual assessments. All the patterns were measured on the Zeiss Elrepho colorimeter and Simon and Goodwin charts were used to calculate the instrumental colour differences. Table IV shows a comparison of the figures which includes the individual observer assessments. It is seen from Table IV that quite good agreement is obtained between the instrumental results and the mean visual assessments, bearing in mind the fairly wide spread in the individual observer's assessments. (The overall colour differences are derived from the observers' assessments in terms of differences in strength, shade and brightness.) In view of the variation between assessments of different colour match- ers, patterns passed or failed against an instrumental tolerance will not be judged similarly by everyone. In addition, there is the uncertainty of instrumental measurement which will contribute to a possible erroneous instrumental decision. However, if the instrument reliability is high com- pared with the size of tolerance, and colour matchers agree to accept the instrumental decision, considerably improved accuracy of colour control should result.
Purchased for the exclusive use of nofirst nolast (unknown)
From: SCC Media Library & Resource Center (library.scconline.org)