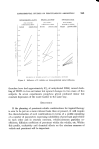
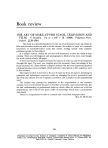
INSTRUMENTAL COLOUR MEASUREMENT AND CONTROL 271 average human observer under particular types of illumination. The values X, Y, Z are called tristimulus values which form the basis of an inter- nationally agreed system known as the ( .I.E. system and may be deter- mined using either a spectrophotometer or a suitable photoelectric tristim- ulus colorimeter. When comparing two colours it is useful to know the relative proportions of X, Y, Z and these are readily obtained from the equations: X X: x+Y+Z Y Y= x+Y+Z z x+Y+Z where x+y+z = 1 It is apparent from the last equation that if x and y are known, z need not be specified, so that a colour can be plotted as a point (x,y) on a graph. The co-ordinates of the point are known as chromaticity co-ordinates. If the chromaticity co-ordinates of the spectral colours, and the non-spectral purples obtained by mixtures of spectral reds and blues are plotted, the locus of points defines the boundary within which all colours must fall. Such a diagram defining this boundary is called the ( .I.E. diagram, and is shown in Fig. 1. The Y value is related to the overall sensitivity of the eye and is taken as a measure of the apparent lightness of a colour. For instance, a white and a black can have the same chromaticity co-ordinates but the white will have a higher lightness (Y value) than the black. In the ( .I.E. system a colour may be completely specified in a three dimensional graph by the quantities x, y, Y where x, y form the ordinate and abscissa in the horizontal plane with Y on the vertical axis. The overall colour difference can be expressed as being made up of two elements: {a) the chromaticity difference which is related to difference in hue and saturation, and {b) the lightness difference. Unfortunately chroma- ticity differences obtained from the chromaticity diagram are not uniformly related to the ability of the eye to discriminate them in different directions and regions of the diagram. In other words, small colour differences which are judged to be visually equal are not necessarily represented by equal chromaticity differences. Similarly, the visual discrimination of small lightness differences varies according to the lightness Y.

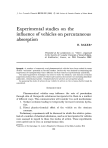
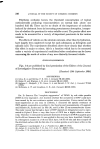
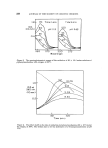
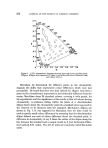
272 JOURNAL OF THE SOCIETY OF COSMETIC CHEMISTS 0.9 0'8 0.7 0.6 0'5 0.4 0.3 0'• 0.1 Figure 1. C.I.E. chromaticity diagram showing Spectrum Locus and MacAdam Ellipses. (Ellipse sizes represent 10 times a just noticeable colour difference from each ellipse centre.) MacAdam (1) determined for different points in the chromaticity diagram the shifts that represented colour differences which were just perceptible. He found that they were best defined by ellipses such that a point on the circumference represented a just noticeable difference from the centre. MacAdam chose 25 standard colours, covering a wide gamut, for his experiments and the significance of his results is that all colours having chromaticity co-ordinates falling within the limits of a discrimination ellipse drawn about the chromaticity point of a standard colour appeared to the observer to be identical with the standard. MacAdam's ellipses are shown in Fig. 1. It was suggested by MacAdam that his data could be used to specify small colour differences by assuming that the discrimination ellipse defined one unit of colour difference about the standard point. A difference in chromaticity of say 3 times the radius of the ellipse along the line between the standard and a sample would be 3 Just Noticeable Differ- ence units (J.N.D. units). The J.N.D. units are commonly called MacAdam units.
Purchased for the exclusive use of nofirst nolast (unknown)
From: SCC Media Library & Resource Center (library.scconline.org)