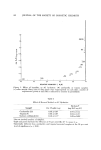
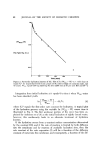
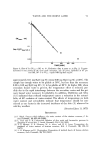
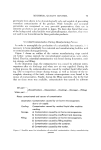
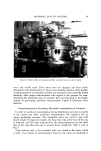
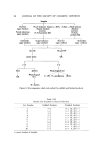
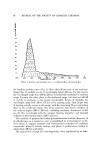
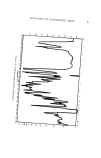
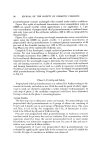
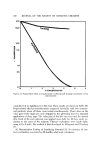
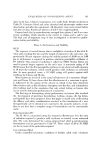
68 JOURNAL OF THE SOCIETY OF COSMETIC CHEMISTS 1.00 (Wmax-W) 0.10 (rag H20/mg S.C.) 0.01 i o ,oo o[o 6OO Figure 2. First-order hydration kinetics of SLC. Plot Of In (Wmax -- W) vs. t with slope in equals K• • for trypsin-harvested 8 mm punch of SC (lateral thigh of caucasian male, age 45 years). Wma• equals 0.90 mg H20/mg SC after 22'80 rain at 97 per cent RH and 30 ø C Integration from initial hydkation at t equals 0 to time t when Wmax water has been absorbed yields where Ktn equals the first-order rate constant for hydration. A typical plot of the hydration process using the variable in (Wmax- W) versus time is illustrated in Fig. 2. The first nonlinear portion of the curve has been ex- plained by Anderson et al (8) as the initial hydration of tightly bound water however, this nonlinearity leads to an alternate treatment of hydration kinetics. If the hydration occurs from a constant surface concentration determined by the constant RH, and if the rate of reaction is limited by both diffusion into the membrane and by reaction of available hydration sites, then the rate constant of the rate expression (2) will be a function of the diffusion constant of water into the membrane, and consequently, a function of the dif-

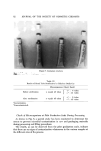
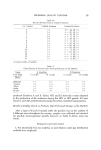
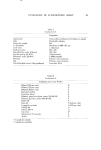
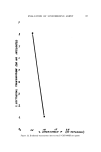
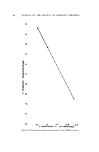
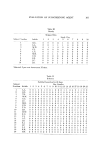
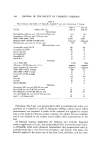
WATER AND THE HORNY LAYER 69 [erenee between the water content at the surface and water within the mem- brane. Allowing for a suitable lag time for equilibrium to be established, the surface layer of the SC is in equilibrium with the water vapor in the atmos- phere. Therefore, k will be large initially and decrease as hydration ap- proachs an equilibrium SS. The surface layer, at equilibrium with water vapor in the atmosphere, will have a water content of Wmax (rag H20/mg surface layer). The interior water content, taken as an average, is represented by W. If K• n is not actually a constant but rather a function of the water con- tent, one might express the rate function K(W) in terms of the degree of hydration as K(W) = K' (Wm•x/W) (5) which is large initially, decreasing as the extent of hydration increases. Substituting eq. 1 in 5 gives K(W)---- K'• wl2 '• L l•J (6) Applying the resulting expression K(W) for K• • in eq. 3 dW [ •rF 71/2 (Wm•x W) =K' L l•j t-'/• dt - (7) Integrahng over the limits of 0 to Wm•x and 0 to t (s) w•ch is cons•ained to descdphon of initial so•tion data as is 1. A •pical plot of eq. 8 is line• over the initial 300 min. of hydration. It should be noted that the linear porhon o• the cu•e beans after t equals 1 rain, as a result of a lag •e •or formahon of equilibrium between water vapor and the suEace ol the sample. Discussion Comparison of hydration parameters in Table I indicates that average dry weights and water content at 97 per cent RH are similar for SC samples harvested by cantharidin blister or trypsin techniques. Sunburn exfoliated samples have lower dry weight, indicating a lower density than samples har- vested by the other methods. In addition, sunburn samples retain more water than either cantharidin or trypsin samples. Some harvest methods involve immersion in water at 60øC for separation of epidermis from dennis (7). In the current work, exposure to 60øC had no detectable effect on hydration of any samples at 97 per cent RH (Table II). However, SC samples were pro-
Purchased for the exclusive use of nofirst nolast (unknown)
From: SCC Media Library & Resource Center (library.scconline.org)