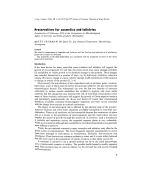
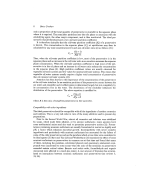
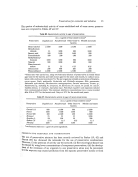
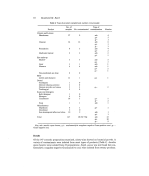
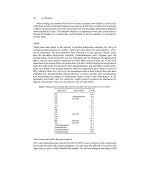
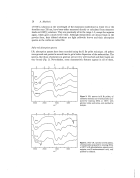
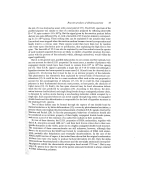
Reaction products of dihydroxyacetone •X\x,x ß I • 'xß'l•'ß• 'X x x_X.x,xx • - ' •+•+ 0 I I 3OO 4OO 5• nm Fig•e 1. U.V. spectra in 0.005 • aqueous solution (1 cm cell) of melanoidins prepared by reacting DHA at 100oC with beta-alanine, glycine, glutamic acid and tyrosine, and purified by dialysis. The solution of beta-alanine has been brought to phi9.8 with ammonia. x, • Ala •, GIy +, Glu O, Tyr. 27 Table II. U.V. absorption in 0.01 •o water solution, of melanoidins obtained by reaction of DHA with aminoacids for 4 h at 100øC (1 cm cell) Aminoacid pH Optical density Gly 6-1 1'91 at 310 nm 10-0 1 '81 at 310 Gly+ trieth 1-72 at 310 Gly+ Na OH 1.28 at 320 Ala 2'02 at 320 Val 9.8 2-24 at 310 Leu 9-7 1'54 at 320 Ser 1'82 at 320 Asp 1-20 at 320 Glu 1.40 at 320 Glu+ Na OH 1.36 at 320 Arg 0.38 at 320 Lys 1.17 at 330 Phe+ Na OH 1.25 at 260, 0,99 at 310 Tyr+Na OH 0.86 at 270, 0.64 at 330 3-aminopropionic 5.9 1.86 at 310 9.8 2-14 at 320 4-aminobutyric 9'7 1.84 at 320 5-aminopentanoic 9.7 1.68 at 320 6-aminohexanoic 9-7 1.63 at 320 8-aminooctanoic 9'7 1.35 at 310 Underlined wavelengths correspond to a maximum. curves with pH was noticed. The spectra (Fig. I) are all very similar, with no special features except for a shoulder (or an occasional maximum) around 320 nm. The mela- noidins of phenylalanine and tyrosine however, show an additional maximum corre- sponding to the aromatic rings of the parent aminoacids (Table H). The optical densities

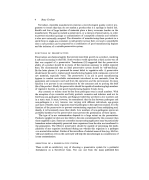
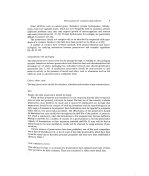
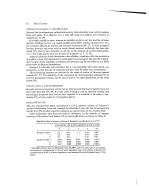
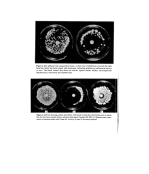
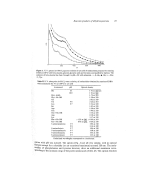
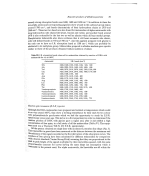
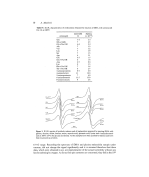
28 A. Meybeck of 0'01 •o solutions at the wavelength of the maximum (underlined in Table II) or the shoulder near 320 nm, have been either measured directly or calculated from measures made on 0-005•o solutions. They are practically all in the range 1-2, except for arginine again, which gave a much lower value. Although melanoidins are almost black in the powder form, their diluted solutions are light yellowish brown and their absorption spectra in the visible are rather flat. Infra-red absorption spectra I.R. absorption spectra have been recorded using the K Br pellet technique. All pellets were ground and pressed a second time to get a better dispersion of the melanoidins. The spectra, like those of polymers in general, are not very well resolved and their bands are very broad (Fig. 2). Nevertheless, some characteristic features appear in all of them, 3 4 5 6 8 I0 14 I I I I i I • I • • I • 3500 2500 1600 I000 crn -I Figure 2. I,R. spectra in K Br pellets, of synthetic melanin and of melanoidins pre- pared by reacting DHA at 100øC with glycine, valine and serine, and purified by dialysis. I I I I I I t I .I 3500 2500 1600 I000 Figure 2. (bis)-I.R. spectra in K Br pellets, of melanoidins prepared by reacting DHA at 100øC with phenylalanine, aspartic acid, arginine and 8-aminooctanoic acid, and purified by dialysis.
Purchased for the exclusive use of nofirst nolast (unknown)
From: SCC Media Library & Resource Center (library.scconline.org)