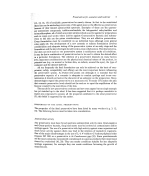
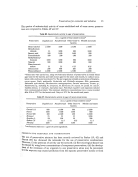
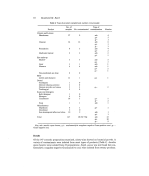
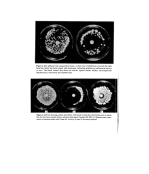
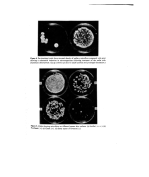
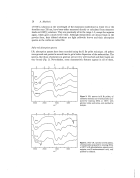
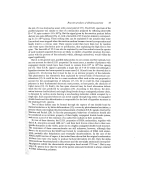
Reaction products of dihydroxyacetone 29 namely strong absorption bands near 3400, 1600 and 1400 cm -•. In addition to these the non-alpha aminoacid corresponding pigments show a band in the carboxyl group region around 1700 cm -•, and bands characteristic of their hydrocarbon chains at 2930 and 2860 cm -x. These last two bands are also found for melanoidins of alpha aminoacids with long hydrocarbon side chains like lysine, leucine and valine, and another band around 2970 is also noticeable for the last two as well as alanine which all bear methyl groups. Phenylalanine melanoidin also shows evidence that it still bears aromatic side chains, with well defined bands at 750 and 700 cm -•. And the pigment prepared with glycine is the only one to have an I.R. absorption band at 1300 cm -x, which can probably be attributed to its methylene group. Melanoidins prepared in alkaline medium gave spectra similar to those of the products obtained without addition of alkali. Table III. I.R. absorption bands observed for melanoidins obtained by reaction of DHA with aminoacids for 4 h at 100øC Aminoacid I.R. bands (cm -•) : Gly 3400, 'Ala 3400, Val 3400, i•!:i .• Leu 3420, Set 3400, '•' Asp 3400 ß .'," Glu 3400 Arg 3350 Lys 3400 ':' Phe 3400 './: Tyr 3400 3-aminopropionic 3400 , 4-aminobutyric 3400 :./ 5-aminopentanoic 3400 6-aminohexanoic 3400 : • 8-aminooctanoic 3400 •-, Electron spin resonance (E.S.R.) spectra 1600, 1380, 1300, 1120, 2980, 2930, 1600, 1450, 2970, 2930, 2870, 1610, 2960, 2930, 2870, 1620, 1600, 1380, 600 1570,1410,1160, 600 1570, 1410, 1160, 600 1600, 1400, 1130, 660, 2930, 2860, 1600, 1400, 1600, 1490, 1400, 750, 1600, 1510, 1410, 1240, 1700,1560,1400, 600 2930, 1700,1560, 1410, 2930, 2860, 1550, 1410, 2930, 2860, 1710, 1550, 2930,2860,1710,1630, 920, 600 1400, 600 1380, 1220, 600 1400, 1170, 600 600 540 700 1170, 600 600 600 1400 1550, 725 Although the DHA melanoidins were prepared and isolated at temperatures which could m no way exceed 100øC, they show a striking resemblance by their dark brown colour with polyacrylonitrile pyrolysates which we had the opportunity to study by E.S.R. spectroscopy some years ago. This led us to a first experiment in order to determine if the reaction product of DHA with glycine gave a signal and, after it did exhibit a high concentration of free spins, to a full study of all the melanoidins (Table IV). The equip- ment used was a Thomson T.H.N. 252 E.S.R. spectrometer. All the spectra obtained are single lines with an almost Lorentzian line shape (Fig. 3). Their linewidths in gauss have been measured as the distance between the maximum and the minimum of the signals recorded as the first derivatives of the absorption curves. The numbers of free spins/g have been calculated for different melanoidins by comparison with a known standard (Varian Strong Pitch) assuming that they are proportional to the ß :? peak to peak height of the signals multiplied by their linewidths squared, with the same proportionality constant for curves having the same shape (an assumption which is reasonable in the present case). For alpha aminoacids, the linewidths are all within the .

30 A. Meybeck Table IV. E.S.R. characteristics of melanoidins obtained by reaction of DHA with aminoacids for 4 h at 100øC Linewidth Spins/g Aminoacid O ( x 10 -•*) Gly 7.5 3.3 Gly+ trieth. 7 4-5 Gly+ Na OH 6.5 2-2 Ala 7 3.2 ¾al 7 3.2 Leu 7 5.9 Ser 7 3'5 Asp 6 2.1 Glu 6-5 1.5 Glu+ Na OH 6 1.8 Arg 6.5 0'4 Lys 9 3'5 Phe+ Na OH 7 5.6 Tyr + Na OH 6 2.7 3-aminopropionic 8.5 6'0 4-aminobutyric 11 10.0 5-aminopentanoic 7 4.0 6-aminohexanoic 11.5 15.0 8-aminooctanoic 9 2.6 Figure 3. E.S.K. spectra of synthetic melanin and of melanoidins prepared by reacting DHA with glycine, alaninc, valine, leucine, serine, aspattic acid, glutamic acid, lysine and 6-aminohexanoic acid at 100oC (37•C for glycine and lysine). All the samples have been purified by dialysis and have been examined as powders. 6-9 G range. Recording the spectrum of DHA and glycine melanoidin sample under vacuum, did not change the signal significantly and it is assumed therefore that these data, which were obtained in air, are representative of the actual linewidths without any line broadening by oxygen. As far as free spin contents are concerned, they fall in the 10 •s
Purchased for the exclusive use of nofirst nolast (unknown)
From: SCC Media Library & Resource Center (library.scconline.org)