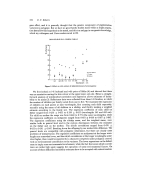
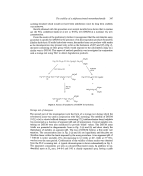
Biological significance of human pigmentation 333 Heritability using the data on fathers ranges from 54 to 84•o, on mothers from 65 to 100•o, and oa midparent from 59 to 78•o. I am inclined to regard the estimates from the mother as being the least reliable. Within a population then, a polygenic hypothesis appears reasonable, and on this skin colour is of moderately high heritability. But the genetic basis of difference between populations is something quite different, and to elucidate this studies of hybrid popula- tions are necessary. One method of analysis (6) is to compare observed distributions of pigmentation (by discrete classes) with the binomial distributions expected were a given number of genes involved. This approach assumes that the reflectance measure- ment is linearly related to the number of genes fo{ pigmentation, that the genes are of equal effect, that they are additive, and that the population is in genetic equilibrium and in a state of random mating. One also needs to know the relative contributions of the parental populations to the hybrid. Stern, using United States negro data, concluded that relatively few genes are involved in the skin colour differences between Europeans and Africans, and his best estimate was four-five gene pairs. Harrison et al. (7) applied a similar method to Brazilian negroes and again found that relatively few gene pairs were involved, three to four giving the best fit. A different method was used by Harrison & Owen, (8), in their investigation of the Afro-European hybrid p•pulation in Liverpool. They partitioned the quantitative variation into components and calculated the number of effective factors responsible for the interparental difference. Their calculations indicate the number of effective factors (= genes) again to be three to four. The authors of these studies are fully aware of the difficulties attending the methods they use, and quite properly are cautious in the presentation of their results. But 'one cannot overlook the similarity that appears to be emerging in the results of these several studies, i.e. that the number of effective factors or genes or chromosome sections res- ponsible for the pigmentation differences between Africans and Europeans are few in number, of the order of three or four. A similar method of analysis has been applied to Indian/European hybrids (5). Our material relates only to first generation (F1) hybrids, so clearly one of the assump- tions of the model, genetic equilibrium, is not fulfilled. Moreover, the two parental populations do not present the complete contrast in skin pigmentation that was the case in the African/European mixtures, so one cannot consider the genes for less and more pigmentation as being equal in proportion in the hybrids. In these circumstances the analysis is to be regarded only as exploratory. The best fit of the observed and the expected distributions in these hybrids seems to be accomplished at one to two pairs of factors or genes, and as the number of gene pairs increases there is a worsening of fit. While it seems entirely reasonable to expect the number of differences between European and Indian to be fewer than between European and African, these results must be regarded as tentative. Interesting indirect supporting evidence as to the small number of genes involved in population differences comes from simulation studies by Livingstone (9, 10). He finds that with four loci the evolution of the range of human skin colour differences would take about 800 generations with no dominance, even with relatively slight differ- ences in fitness (6•o maximum) and migration between populations. In the subsequent model he also took into account the effects of population size, genetic drift and allele fixation. This work shows that observed differences are not incompatible with reasonable estimates of selection in man and duration of modern human evolution.

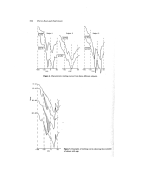
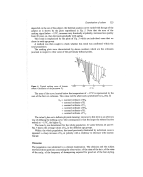
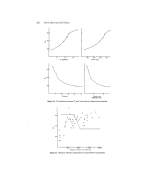
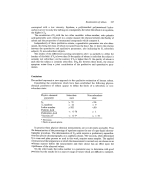
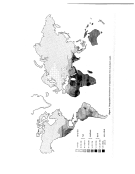
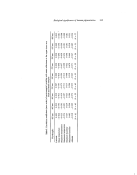
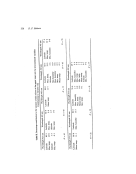
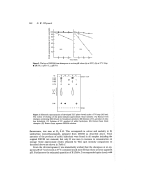
334 D. F. t•oberts GEOGRAPHICAL DISTRIBUTION Equally fascinating are the pronounced geographical gradients in skin colour, and these too can be further examined using the results of reflectance spectrophotometry. So far some 130 samples, approximately half of each sex, are available to represent the world's indigenous populations. Results are not all technically comparable, for though most were obtained with the EEL spectrophotometer, others were obtained with other models where the wavelengths used are not the same for only a proportion of the samples are the data given at all nine wavelengths available on the EEL instrument (425, 465, 485, 515, 545, 575, 595, 655, 685 nm) the skin sites examined are not always the same the samples vary in size, relate to individuals of different ages. The data are certainly too few for mapping. However, they can be used for an examination of those environmental variables with which pigmentation variation is most closely related. The available data were scrutinized for comparability, and seventy-seven samples were regarded as sufficiently comparable for analysis. Each sample was located suffi- ciently precisely for values of the following environmental variables to be assigned to it: latitude, mean annual temperature, mean maximum temperature (average of the highest each year), mean minimum temperature (average of the lowest each year), maximum mid-day humidity (highest monthly mean), minimum midday humidity (lowest monthly mean), and altitude. These geographic and climatic variables are of course not indepen- dent of each other, as the zero order correlations show there is for example an obvious influence of latitude on temperature, and a close correlation of mean temperature with maximum and minimum temperature. On account of these intercorrelations, our analysis (11) took the form of an examination of zero order correlation coef- ficients of reflectance readings with each environmental variable to show the general associations, and subsequent examination by stepwise regression in an endeavour to identify the order of importance in which these environmental variables contribute to the variation in skin pigmentation. At the upper inner arm, most samples are available at wavelength 685, fewest at wave- lengths 485 and 575. Association with latitude predominates (Table I), accounting for between 88• (485 nm) and 70•o (685 nm) of the total variance in mean reflectance. second important variable appears to be mean temperature which, considered alone, would account for between 83•o (485 nm) and 36•o (655 nm) of the total variance. The order of the remaining variables differs from wavelength to wavelength, but in general the extreme temperature readings cSme next, then the humidity, while altitude shows the lowest correlations. Associations of reflectance with latitude and humidities are con- sistently positive, with temperatures and altitude negative. The association with graphical variables is clearly very strong, reflectance increasing with increasing latitude, decrease in temperature, and increasing humidity. Taking into account the intercorrelation of the geographical variables in order of importance (i.e. proportion of the total variance accounted for) by stepwise regression, the order of the variables changes (Table 2). The contribution of latitude alone (since it predominates in the zero order analysis) remains unchanged, accounting for between 77 and 88•o of the total variance for all wavelengths except 685 nm where it accounts for 70•o. The addition as an independent second variable of maximum temperature at wavelengths 425, 465, 515 and 545 accounts for a further 10-21•o or the addition of , mean temperature at wavelengths 485 and 575 for 11 •o. At the three longer wavelengths maximum humidity moves up into second place, accounting for some 2-13•o.
Purchased for the exclusive use of nofirst nolast (unknown)
From: SCC Media Library & Resource Center (library.scconline.org)