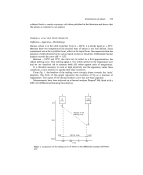
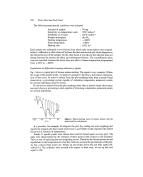
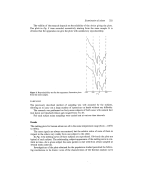
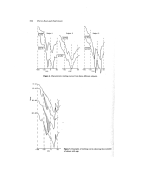
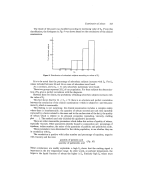
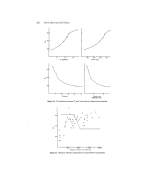
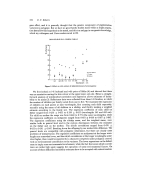
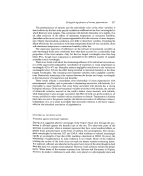
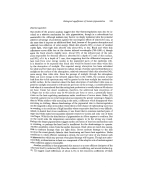
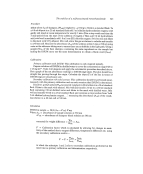
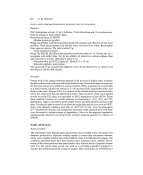
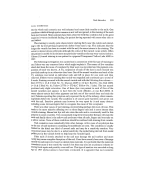
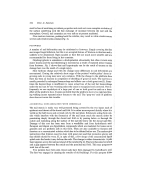
Examination of sebum 321 The validity of the research depends on the reliability of the device giving the plots. The plots in Fig. 3 were recorded successively starting from the same sample. It is obvious that the apparatus can give the plots with satisfactory reproducibility. Figure 3. Reproducibility test for the apparatus. Successive plots from the same sample. I I - IOO -50 I I . O 5O TøC SAMPLING The previously described method of sampling was well accepted by the subjects, allowing us to carry out a large number of operations on heads without any difficulty. The research was performed on forty-seven subjects of both sexes with natural hair (not dyed, not bleached) whose ages ranged from 5 to 65. For each subject many samplings were carried out at various time intervals. Results The melting plots for human sebum are all in the same temperature range (from - 100øC to 50øC). The same signals are always encountered, but the relative ratios of some of them in respect to the others vary widely from one subject to the other. In Fig. 4 the melting curves of three subjects are reproduced. Obviously the plots are typical of each subject. The relationship, subject-appearance of the melting curve is con- stant in time--for a given subject the same pattern is met with from sebum sampled at several weeks intervals. Investigations of the plots obtained for the population studied permitted the follow- ing conclusions to be drawn: none of the characteristics of the thermal analysis curve

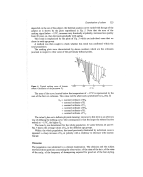
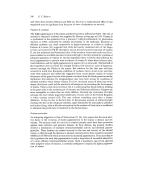
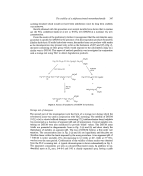
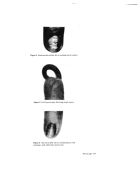
322 _Pierre Bord and Nob? Goetz •- ' 20- 60 60-65 Figure 4. Characteristic melting curves from three different subjects. I I I I -5O 0 (øC) I 5o Figure 5. Examples of melting curves showing the evolution':'?, of sebum with age. :•
Purchased for the exclusive use of nofirst nolast (unknown)
From: SCC Media Library & Resource Center (library.scconline.org)