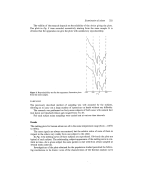
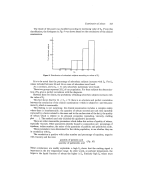
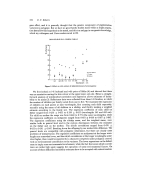
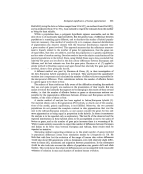
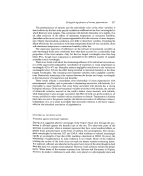
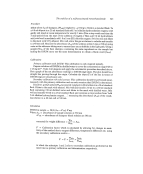
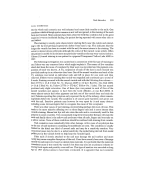
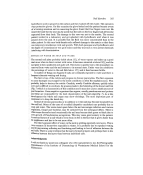
Examination of sebum 319 collected leads to results consistent with those published in the literature and shows that the sebum so collected is not altered. Definition--Apparatus--Methodology Human sebum is in the solid crystalline form at - 100øC it is wholly liquid at +50øC. Between these two temperatures the physical state of sebum is not well defined. Some constituents are in the crystalline form, others in the liquid form. One cannot exclude the presence of other physical forms such as liquid crystals or emulsions. Differential thermal analysis records the curve AH ----- f (T). Between -100øC and 50øC, this curve can be called, as a first approximation, the sebum melting curve. This melting signal is very widely spread on the temperature axis and we are therefore led to measure weak AH values against units of temperature. It is therefore necessary to work at high sensitivity and the apparatus, under these conditions, is also sensitive to specific heat (Cp) variations. From Fig. 1, the baseline of the melting curve strongly slopes towards the 'endo' direction. The form of this graph represents the evolution of Cp as a function of temperature. This aspect of the thermal analysis curve has not been exploited. Measurements have been achieved on a thermal analyser Dupont © 900, fitted with a DSC cell (Differential Scanning Calorimetry). EXO (AH) ENDO Solid Baseline of the .,,melting curve Melting range I Liquid i -I00 -50 0 50 (T øC) Figure 1. Localization of the melting curve of sebum on the differential scanning calorimetry plot.

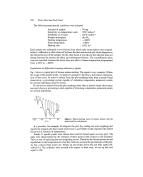
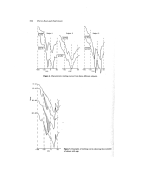
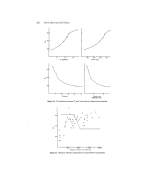
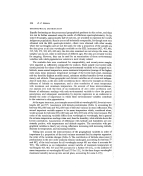
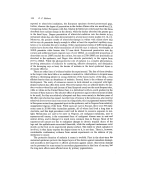
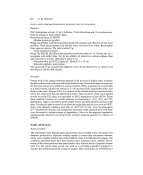
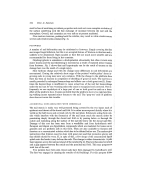
320 _Pierre Bord and Noel Goetz The following experimental conditions were adopted Amount of sample Sensitivity on temperature scale Sensibility on T scale Sample atmosphere Starting temperature Final temperature Heating rate : 30 mg : 50øC inches -x : 0,2øC inches -• : dry N• : - 100øC : +50øC : 10øCm -x Each sample was submitted to two fusions from which only second plots were retained. Indeed, a difference is often observed between the first and second plot which depends on the thermal history of the sample. On the other hand, it was shown that the plot does not change between the second, the third, and subsequent fusions. The crystallization plots were not recorded, because the device does not allow a linear temperature programmed from +50øC to - 100øC. Exploitation of differential scanning calorimetry signals Fig. 2 shows a typical plot of human sebum melting. The signal is very complex. Within the scope of the present study, we shall not attempt to develop a theoretical interpreta- tion of this curve. In order to obtain from the plot anything other than a purely visual observation, a processing system capable of obtaining comparative numerical results for several individuals must be chosen. If one tries to achieve from the plot anything other than a purely visual observation one must choose a processing system capable of obtaining comparative numerical results for several individuals. I I I I . - I00 -50 o 5O (-roc) Figure 2. Typical melting curve of human sebum, with the points used for calculations. It is possible, for example, tc integrate the plot (by cutting out and weighing) and exploit the integral plot that would result from it, and which would represent the melted fraction as a function of temperature. Finally 11 specific points were chosen that could be found again on every plot. The plots were characterized by the ordinate of these points (with respect to the baseline). This is a way of exploiting but not integrating curves. Therefore the chosen points are not equidistant on the temperature axis but they take into account the peculiarities of the plot. As Fig. 2 shows these points are: Slopes up and slopes down (Pa and Pd) peaks (P) valleys (V). The ordinates were normed with respect to their sum we set up this sum equal to 100.
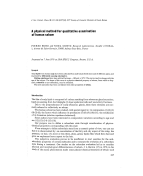
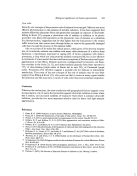
Purchased for the exclusive use of nofirst nolast (unknown)
From: SCC Media Library & Resource Center (library.scconline.org)