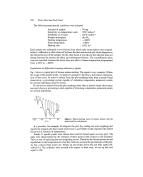
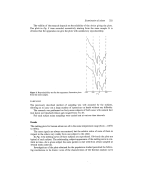
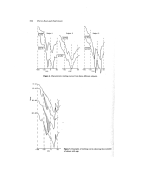
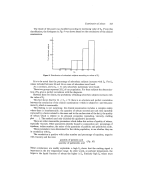
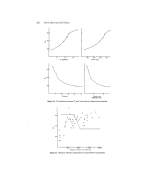
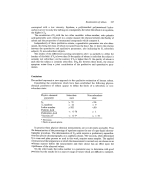
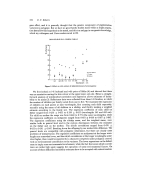
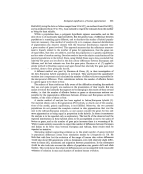
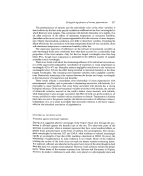
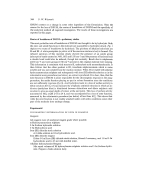
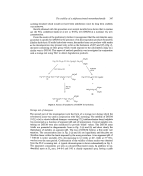
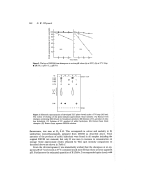
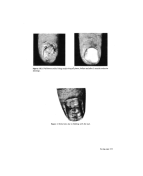
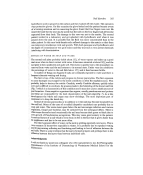
Examination of sebum 323 depended on the sex of the subject the thermal analysis curves varied with the age of the subject as is shown by the plots reproduced in Fig. 5. Note that the area of the melting signal below - 15øC, increases very drastically at puberty, increases less quickly from 20 years on, then decreases gradually with ageing. This trend is emphasized by the plots of Fig. 5 which are individual cases that we chose in each age group. A method was then sought to check whether this trend was confirmed within the total population. The melting plots were characterized by eleven numbers which are the ordinates •..:. (normed in respect to their sum) of the previously defined points. . ß ,,. :.: ,. , :: Figure 6. Typical melting curve of human -100 -50 sebum. Calculation of the parameter I o (ToC) I 5O The area of the curve located below the temperature of - 15øC is represented by the sum of the first six ordinates. This value will be afterwards symbolized by •26 (Fig. 6) Z + normed ordinate of P• + normed ordinate of V• + normed ordinate of Pa• + normed ordinate of P•. + normed ordinate of V2. The value Z• has not a definite physical meaning: recourse to this term is an arbitrary way of defining the melting curve. One consequence is that the larger the sebum fraction melted at - 15øC, the higher The term Z• was determined for the whole population. It varies between 26 and 57. Fig. 7 shows the average values of Z6 in the different age groups. Within the whole population, the trend previously illustrated by individual cases is repeated: a sharp increase of r,• at puberty with a tendency to decrease with increas- ing age. Discussion The population was submitted to a clinical examination. The clinician and the subject answered three questions concerning the observation' of the state of the hair of the state of the scalp of the frequency of shampooing required for good set of the hair-styling.

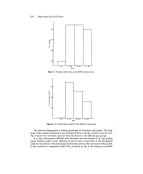
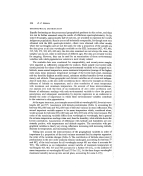
324 Pierre Bord and No#l Goetz 45 • 4o 35 3o I 11~20 21-40 41-60 Years Figure 7. Average values of E8 in the different age groups. 75 10 11-20 21-40 41-60 Years Figure 8. % of seborrheic subjects in the different age groups. The answers distinguished a certain percentage of seborrheic individuals. The diag- nosis of this clinical examination was formulated from a strictly cosmetic point of view. Fig. 8 shows how seborrheic persons were distributed in the different age groups. It is clear that persons affected with seborrhea are encountered in all age groups, except children under 8 years. Between 13 and 18 years of age 90•o of the investigated subjects were affected. The percentage of seborrheic persons then decreased with age and, if this evolution is compared to that of Z 0, as shown in Fig. 8, the similarity is evident.
Purchased for the exclusive use of nofirst nolast (unknown)
From: SCC Media Library & Resource Center (library.scconline.org)