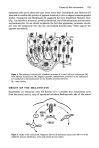
Figure 3. The complete measuring system. Facing page 646

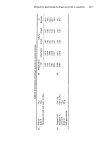
On particle size distributions of aerosol sprays Table 1II. Valve/actuator systems * 647 Hardware ]- Valve housing Vapour Actuator combination orifice phase tap type (inches) (inches) 1 0.025 -- 1303 (Four-channel) 2 0.025 -- 015 Standard 3 0.080 -- 1303 (Four-channel) 4 0.080 -- 015 Standard 5 0.025 0.013 1303 (Four-channel) 6 0.025 0.013 015 Standard * Stem orifice 0.020 inches in all systems. ]' All valve/actuator systems ex. Metal Box Company Limited, UK. • The 1303 actuator has a four-channel swirl chamber for mechanical break-up of aerosol droplets. RESULTS The number/size information obtained for each spray was analysed as follows: the particle size information was computed on a mass basis and plotted on a logarithmic probability scale. From these plots the mass median diameter (the diameter above and below which lies 50 •o of the mass of the particles)was read off. The mass-median diameter was obtained in order to represent the coarseness of the spray. Typical cumulative size distribution curves are given in Fig. 4 (hardware combinations: 0.020 inch stem, 0.025 inch housing, 0.013 inch vapour phase tap and 1303 actuator). Particle D•ameter 300. (microns) 100. 50- lO- Product/ 5- a Propellent I Distance a.35/65 28cm b. 15/85 28 cm c C, 15/85 48cm 0.01 0"05 O.•i • 1•3 5'0 9•3•5 9'9 9•9 9999 Cumulative Weight Percentage Figure 4. The particle size distributions of aerosol systems studied. The condition of straight line plots as a criterion for log-normality was not applied because the data were limited by the extremes of the size ranges used and it had been assumed that all particles in a channel were equal in size to the mid point of that channel. Such assumptions can be further complicated by the unequal widths of the channels on some size ranges. An improved method of data analysis would be to describe the infor- mation obtained by the distribution function, from which parameters can be derived that can characterise the data. Raabe (20) has described the use of the log-normal function in particle size analysis, together with a maximum likelihood method for fitting and testing the fit of a log-normal function to grouped particle size data.
Purchased for the exclusive use of nofirst nolast (unknown)
From: SCC Media Library & Resource Center (library.scconline.org)