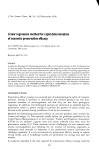
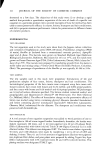
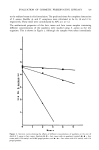
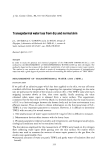
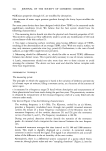
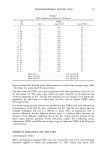
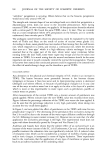
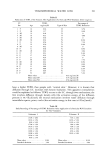
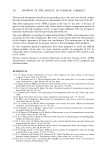
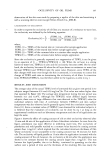
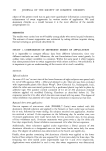
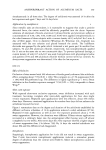
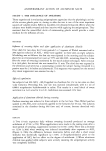
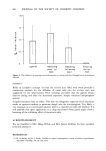
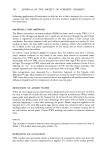
TRANSEPIDERMAL WATER LOSS 335 FREQUENCY MODULATION POWER SUPPLY , tnz I COMPUTER RECOR Figure 1. Schematic diagram of the experimental device. K: KLYSTRON, I: Isolator, A: Attenuator, C•,2: Resonant cavities, D•,2: Crystal detectors, P: air pump, FM: Flow meter, H: Hygrometer, S C: Sampling chamber. two cavities. The measuring surfaces of the "sampling chambers" is 30 cm 2. Air flow is adjusted by metering valves and the main rate is 20 l/hr (liters per hour). For example in the case of forearm measurement, the sampling chamber is placed on the arm, the bottom is pulled up and the air passing along the skin collects the water vapor due to TEWL. The air then fills one of the cavities thus causing a frequency shift which is computed and recorded. Figure 3 represents a recording of the phenomenon. A measurement is achieved in about 2 min. The difference •xF• --•XF0 is directly related to the amount of water vapor released by the skin. Our apparatus has been calibrated by accurately weighing a box containing water, closed by a plastic membrane. Thus, the relationship between •xF• --•xF0 and water loss has been directly established. a • __.b Figure 2. Schematic design of the "sampling chamber." a: air inlet b: air outlet, c: pull-up screw.

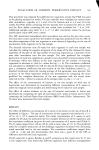
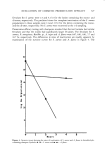
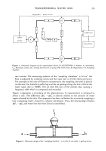
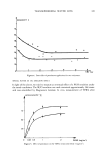
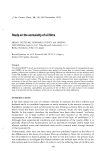
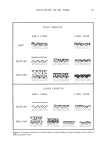
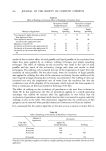
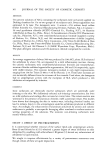
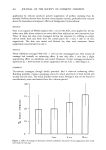
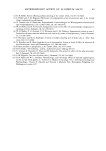
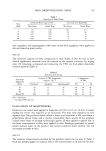
336 JOURNAL OF THE SOCIETY OF COSMETIC CHEMISTS t o t o . •' t• t•. •' t Figure 3. Recording of the phenomenon. At time t o bottom of the "sampling chamber" is pulled up. Three minutes after, the system has reached equilibrium. At time t• the bottom is pulled down AF• -- AF0 (frequency difference variation of the cavities) is proportional to the TEWL value. Experimental protocol The measurements were carried out at room temperature (22-25øC) and humidity (35-45%). These physical parameters (humidity and temperature) were recorded continuously during the measurements. Each volunteer was taken into the laboratory one hour before the measurement was made and encouraged to relax in order to be in equilibrium with his new environment. The measurements were carried out four times successively on the dorsal side of the forearm, but the first recording was systemati- cally rejected because stress can alter this result. After obtaining these first values, which characterize the TEWL of the patient, we applied the product under examina- tion to the skin. In the case of measurements on emulsions, it is essential that they are carried out 1 hr after application in order that the water in the emulsion has had time to evaporate and is consequently not included in the TEWL value. Previous measure- ments of water loss of the emulsion applied on a plastic plate have shown that 1 hr was sufficient for allowing water to evaporate. TRANSEPIDERMAL WATER LOSS VALUES With the previously described device, we have measured the TEWL on 21 volunteers from our laboratories. The results appear in Table I. The third column shows the averaged value of the three measurements the last column represents a simplified clinical statement on the state of the skin. For all 21 volunteers the mean value of TEWL is 0.61 mg/cm2/hr, and the standard deviation is 0.3 mg/cm2/hr. The data already reported in the literature do not allow a precise and quantitative description of the phenomenon (7,8,10). Very different experimental conditions under which the various results were obtained could be an explanation. Two remarks can be made: ß the published values range from 0.3 to 1.2 mg/cm2/hr.
Purchased for the exclusive use of nofirst nolast (unknown)
From: SCC Media Library & Resource Center (library.scconline.org)