244 JOURNAL OF THE SOCIETY OF COSMETIC CHEMISTS 7. To determine the quantity of NDEIA present in the cocamide DEA, use the following equations: ng NDE1A standard injected ng NDEIA = Response of NDEIA standard x Response of NDE1A in Sample, ppb NDEIA ng found x 50 ml x 10 ml x 400 •tl x 1000 wt. of sample (g) x 5 ml x 50/al x 25/al F. ANALYSIS OF FINISHED PRODUCT USING RCSS HPLC Parameters for the initial separation and quantitation of NDEIA can be found under Section E of this experimental section. Procedure The preparation of NDEIA standards and the preparation of a standard linearity curve for NDE1A can be found under "Method of analysis for cocamide DEA," Section D in this experimental section, except that the diluting solvent and mobile phase for the Radial Pak B is 30:70 tetrahydrofuran/methylene chloride. The mobile phase for the Radial Pak A cartridge is water. Sample Preparation.' 1. Weigh 2-3 g of sample into a 10-ml volumetric flask. 2. Add 3 ml of the THF (UV grade) and swirl until the sample dissolves. Dilute to volume with the same solvent. Determination of NDEIA in Finished Products.' 1. Make 25-/xl injection of standard on a Radial Pak B column to determine retention volume of NDE1A. 2. Make 25-/xl injection of sample and collect the area corresponding to the retention volume of NDE1A. 3. Evaporate each collection to dryness and reconstitute in 100/xl of 95:5 water/metha- nol. 4. Make 25-/xl injection of the reconstituted collected sample onto a Radial Pak A column using water as the eluting solvent, and record peak height (cm) of NDEIA in sample. 5. To determine the concentration (ppm) of NDEIA present in the reconstituted collected sample, use the following equation: y=ax+b y = concentration of NDE1A present in the reconstituted collected sample a = slope x = peak height in (cm) b = y-intercept (a and b were calculated from standard NDEIA data points). 6. To determine total amount of NDE1A present in the original sample, use the

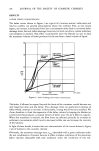
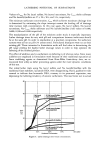
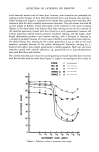
NITROSAMINE ANALYSIS 245 following equation: ppm (in sample) = ppm (found) x 100/al x 10 ml (25/al) (sample wt. in grams) RESULTS AND DISCUSSION In performing trace analysis by HPLC at ppb or ppm levels, the advantage of operating at the wavelength maximum for a compound is only one part of the story. The detection limit is generally defined as that quantity of compound which provides a signal that is discernible above the baseline noise. Most analytical chemists, to assure accurate measurements, accept a 3:1 signal-to-noise ratio for the limit of detection. The type of UV detector used must depend on the response for the compound and the inherent operating characteristics of the detector (background noise level and drift). A fixed wavelength detector employs a mercury vapor lamp which transmits greater than 95% of its energy at 253.7 nm. This results in a very intense source of energy which is spectrophotometrically stable. A variable wavelength detector uses a deuterium lamp which transmits its energy from 190 to 700 nm. A spectrophotometric grating divides this energy into discrete bands to select the analytical wavelength. Therefore the energy from the light source is divided throughout the spectral region and it is not as intense or stable as the mercury emission line at 253.7 nm. To investigate the appropriate UV detector for NDE1A, using this information, the detection limit for NDEIA was determined by comparing the linear response for eight standard aqueous NDEIA solutions using both fixed and variable wavelength detectors. Although the statistical data indicates that the precision and accuracy using both detectors is comparable, the slope of the curve for the fixed wavelength detector shows greater response above 2.5 ng with a 95% confidence limit of _+0.5 ng. For this comparison, both detectors were run at their maximum sensitivity, with the variable wavelength detector set at 234 nm. Because of its greater sensitivity, the 440 fixed wavelength detector was used for the analysis of NDEIA, even though the sensitivity below 2.5 ng was indistinguishable for both detectors. The results for the calibration curves consistently gave good correlation coefficients, and although it is always advantageous to generate a calibration curve daily, the precision and accuracy of HPLC allows the use of a single standard and an intercept of zero to generate the day-to-day working calibration curve. Therefore, when analyzing samples, the NDEIA levels can be calculated using the standard curve or the single standard. ANALYSIS OF ETHANOLAMINES The most logical starting point for studying the contamination of NDE1A in cosmetics is with di- and triethanolamine, since these are cosmetic raw materials and direct precursors for the formation of NDE1A. A statistical analysis of the method developed by Rahn and Mitchell (10) was undertaken to evaluate the applicability of the HPLC method for the routine screening of di- and triethanolamines for 1 ppm levels of NDEIA.
Purchased for the exclusive use of nofirst nolast (unknown)
From: SCC Media Library & Resource Center (library.scconline.org)