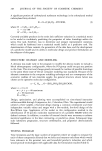
248 JOURNAL OF THE SOCIETY OF COSMETIC CHEMISTS A significant portion of carboxylated surfactant technology is the ethoxylated methyl carboxylated fatty alcohol: R--O--(C2H40)•--R'COOH, (I) where: R = C6H•3--to CmH37-- n = 1 to 100 R' = CH 2-- to C2H4--. Currently available products in the series lack sufficient variation (in a statistical sense) to be useful in confidently predicting the properties of other homologs within the series. Our task, therefore, was to determine and prepare representative variations which could be fashioned into a statistical model useful as a predictive tool. The determination of these variants, the generation of the data base, and the development of a predictive model and its utility in molecular design and product formulation are the subjects of this paper. STRUCTURE CHANGES AND MODELING A decision was made early in the program to modify the alkoxy moiety to include a block ethoxypropoxy configuration, where the PO group could occupy any position in the chain. This structural change greatly increased the number of possible homologs to the point where state-of-the-art computer modeling was mandated. Because of the inherent constraints in the computer modeling technique and as a consequence of the economic realities of raw materials supply, the general structure shown below was chosen as the operative molecular configuration. n--Cn H2n +l O--(EO)m(PO)p(EO)qRCOOH, (IX) where: n = 6 to 22 m+p+ q=60maximum p = 20 maximum R = CH2--. Design, optimization, and plotting were accomplished on time-shared interactive utilities available through Compuserve, Inc., Columbus, Ohio. The experimental model utilized a three-variable, n-factorial design sharing a common centerpoint and three independent variable values and ranges with a five-variable, five-level design of the Box-Wilson type. Application of the model to this configuration resulted in the identification of 44 specific molecules representative of a possible 800,000 within the defined universe. In addition, a number of internal checks were necessary to achieve statistical significance in the later contouring, or predictive, phase. Subsequent large scale laboratory preparation, structure confirmation, and properties' determinations followed. TESTING PROGRAM Time limitations and the large number of properties which we sought to measure for each of these compounds dictated that we select and measure only those which would have relevance to the personal care and household products industries and which would provide technologists with applicable data for formulation studies (Table I).

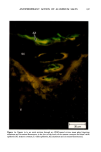
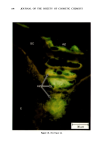
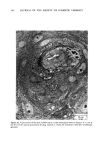
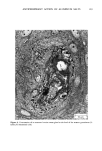
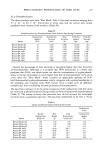
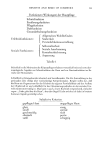
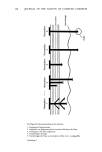
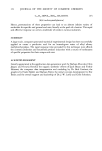
COMPUTERIZED DESIGN OF SURFACTANTS 249 Table I Properties of Novel Carboxylates Measured in the Testing Program a. Ross-Miles Foam Height b. Surface Activity (Surface Tension) c. Lime Soap Dispersion Activity d. Draves Wetting e. Cationic Interference f. Solubility g. HLB h. Detergency CONTOURING AND THE PREDICTIVE MODE The properties listed in Table I were measured for each of 44 compounds, in many instances over several concentrations, temperature, and pH ranges. Upon completion, the resultant data, properly formatted and coded, were subjected to computer manipulation to give mathematical models of the behavior or performance of the product system in the form of functions of the specified variables given in Table II. These models were then utilized to generate representatives of selected performance ranges in chosen values of the variables listed above. One useful type of representation is the contour map. Figure 1 shows the contour map of surface tension at pH 10, 0.01% active concentra- tion under the constraints indicated. Also given is the regression equation for the optimization program. Figure 1 is keyed to Table II. Depicted in terms of another coordinate system, Figure 2 shows the three dimensional graphics for surface tension under these conditions. Shown in these two 16- Z14- 12- 10 1.00 Surface Tension {0.01%, pH 10) = 161.1 -- 10.67a -- 4.00b -72.31c -- 8.66d -- 0.46e + 0.33a 2 -- 0.13ab +0.23b 2 + 2.94ac 47.5 +1.74bc + 18.21c • +0.50ad + 0.04be :, 4.o.o / / 5,00 • 0,00 • •,00 20.00 Total •lkox•l•tion Figure 1. Surface tension response surface in dynes/cm at: 0.01% concentration pH = 10 PO block position = 3 percent PO = 40% and percent conversion = 22.0%.
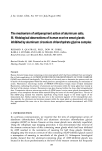
Purchased for the exclusive use of nofirst nolast (unknown)
From: SCC Media Library & Resource Center (library.scconline.org)