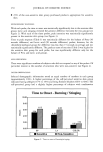
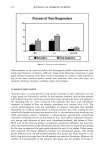
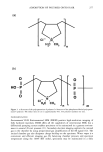
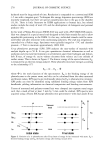
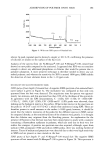
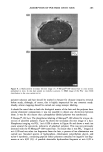
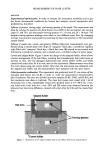
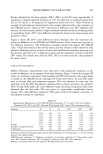
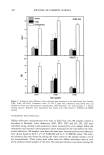
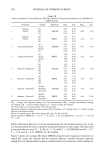
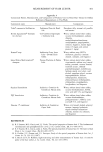
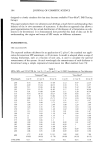
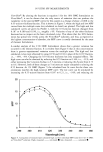
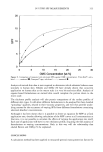
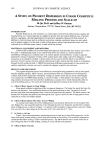
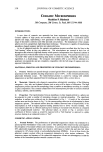
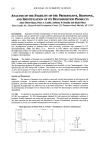
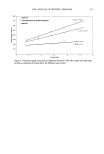
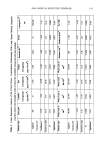
306 JOURNAL OF COSMETIC SCIENCE Thus it can at present be applied only to formulations containing non-scattering ab- sorbers, and to formulations that do not retain a "milky" appearance on substrates. However, this still leaves plenty of scope for investigating the actual distribution of formulations on substrates, thereby assessing the test suitability of the substrates. For- mulations containing more than one absorber can, if necessary, be accommodated, since the absorption coefficients are additive within the exponential law. EXPERIMENTAL DETAILS Simple formulations containing 1 wt %, 2.5 wt %, and 10 wt % of octyl methoxycin- namate [OMC-Parsol MCX © (Givaudan)] were applied to Transpore © tape and Vitro- Skin © and their spectral protection curves assessed on a Labsphere UV-1000S spectro- photometer. Application of the formulations to the substrates was carried out by expe- rienced operators. The variation of transmittance over the 290-400 nm wavelength range was measured, from which SPF can then be calculated (3). Multiple scans were carried out on each system. Sun protection factors and UVA/UVB ratios were calculated for each sample. Averages of the spectral scans are listed in Table I, together with the average of the SPFs obtained on each sample (standard deviations in brackets) and the average UVA/UVB ratios. The samples were not subjected to any specific period of drying time prior to 20 15 Q- 10 , // / \ \ \ \ A\ x \ 0 i i I i i I 290 300 310 320 330 340 350 360 Wavelength [nm] Figure 2. Comparison of measured and calculated mono-protection factors for OMC on Vitro-Skin © substrate. 1 wt % OMC, measured --., calculated m 2.5 wt % OMC, measured ....... , calculated O 10 wt % OMC, measured .... , calculated '.

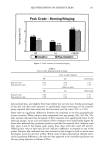
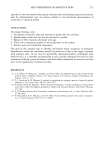
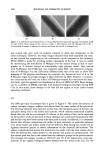
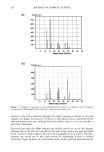
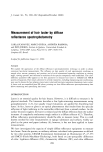
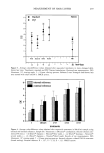
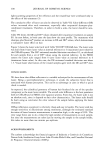
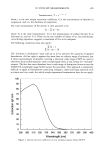
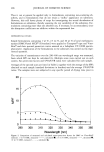
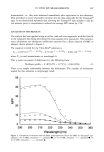
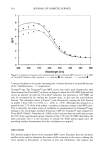
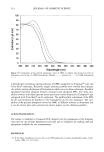
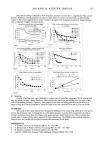
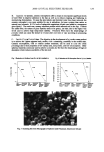
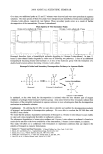
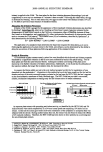
IN VITRO SPF MEASUREMENTS 307 measurement, i.e., they were measured immediately after application to the substrates. This introduces a source of possible variation into the data, especially for the Transpore © tape. It was determined separately that allowing the Transpore © tape samples to dry for ten minutes prior to measurement reduced the average SPF values by 15%. ANALYSIS OF THE RESULTS The analysis has been applied using an ad hoc trial-and-error approach, with the final fit to the measured data being determined by least squares error assessment. The transmit- tance calculations use absorption coefficients measured for a dilute solution of OMC in ethanol, shown plotted in Figure 1. The equation evolved for the Vitro-Skin © substrate is T s = 0.187 (10 -0'55 - c- E/tooo) + 0.75 (10 -5 ß c. E/tOO0) + 0.063 (10 -256' c' E/1000) where T s is total transmittance at wavelength X. This is more convenient if abbreviated to the following form: Thickness profile = 0.18710.55] + 0.75[5] + 0.063[256] (1) There is no simple relationship between the thicknesses. The number of thicknesses needed for this substrate is surprisingly small. 50 40 30 20 10 \ -. ß \ 0 ' I I I I ? - 'r - , 290 300 310 320 330 340 350 360 Wavelength [nm] Figure 3. Comparison of measured and calculated mono-protection factors for OMC on Transpore © tape substrate. 1 wt % OMC, measured --., calculated I 2.5 wt % OMC, measured ....... , calculated O 10 wt % OMC, measured .... , calculated A.
Purchased for the exclusive use of nofirst nolast (unknown)
From: SCC Media Library & Resource Center (library.scconline.org)