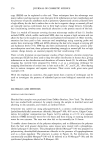
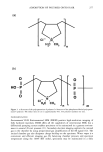
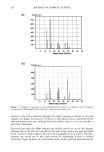
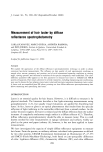
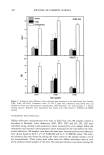
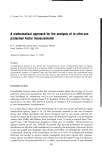
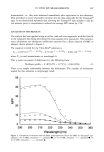
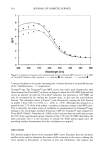
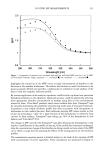
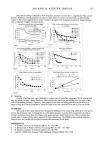
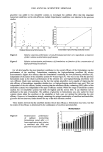
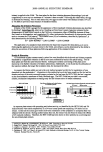
312 JOURNAL OF COSMETIC SCIENCE 7O 30 20 ' ..... '*"-,..•.,% • 0 T 290 300 310 320 330 340 350 360 Wavelength [nm] Figure 8. Comparison of measured and calculated high and low individual MPF scans for 10 wt % OMC on Transpore © tape substrate. High, measured --, calculated I low, measured ....... , calculated where it can be seen that the Transpore © tape curve flattens out at high absorber concentrations, producing a range of SPFs that agrees roughly with the Vitro-Skin © data. This is a direct result of the presence of a small fraction of uncovered substrate. The Vitro-Skin © data are displaying the characteristic, fortuitous linearity of SPF variation with concentration that is generally noted in sunscreens. The plot also contains the measured SPF values, showing excellent agreement between calculated and measured SPFs. A distinctive recurring deviation of the calculated curves from the measured ones occurs mainly at the two lower concentrations in the 290-310 nm wavelength regions (see, for instance, Figures 6 and 7). The calculated curve shapes parallel that of the measured absorption properties of OMC (Figure 1). It would appear that the absorption charac- teristics of OMC are slightly different in the formulation from those applying to its alcohol solution. It is known that the solvent can influence the absorption characteristics of organics (9). It is also possible that at these lower wavelengths other components in the formulation have significant absorption properties. These effects are demonstrated in Figure 10, where the absorption curves for OMC in alcohol and mineral oil, a component in the formulation, are compared with an absorption curve obtained from a very thin film of the 1% OMC formulation. It is clear that the thickness profile analysis could be improved if a reliable thin film method could be established for measuring the absorp- tion characteristics of the actual formulations. However, separate derivation of the profiles using all three absorption curves shows that the curve differences in Figure 10 have only relatively minor impact on the profile.

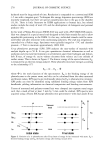
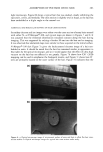
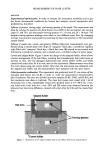
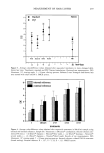
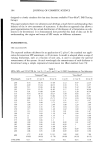
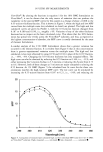
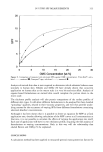
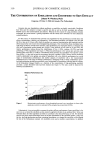
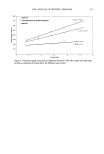
IN VITRO SPF MEASUREMENTS 313 20 n 10 ,/ 0 I I I I I 0 5 10 15 20 25 30 OMC Concentration [wt.%] Figure 9. Comparison of measured and calculated SPFs against OMC concentration. Vitro-Skin ©, calcu- lated --., measured I Transpore © tape, calculated ....... , measured O. Analysis of excised skin data is now required to determine which substrate behaves most similarly to human skin. Rhodes and Diffey (8) have already shown that sunscreen application on human skin at the macro scale is a very hit-and-miss affair. Analysis of organic-based formulations on excised skin would complete the picture down to the micro scale. The thickness profile analysis will also permit comparisons of the surface profiles of different skin types. It will allow different formulations to be analyzed for their detailed "spreading" qualities, related to their viscosity properties, and will thus provide under- lying reasons for the occurrence of varying SPFs from different formulations containing identical absorber concentrations. Although it has been shown that it is possible to derive an equation for MPF at a fixed application rate, thereby allowing calculation of the MPF curves at all concentrations at that rate, it is not possible to calculate the effects of varying the application rate itself. Each rate of application will have its own thickness profile, requiring the full analysis of formulations at varying concentrations. Only in this way will the relationship that eluded Brown and Diffey (5) be explained. CONCLUSIONS A calculation method has been applied to measured spectral mono-protection factors for
Purchased for the exclusive use of nofirst nolast (unknown)
From: SCC Media Library & Resource Center (library.scconline.org)