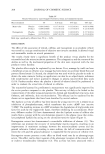
DSC STUDIES OF SEBUM MODELS 217 to pure compounds usually decreases their melting point. In the DSC thermogram, investigating the effect of C-16 (Figure 3), the peak, Mp-4, is possibly a combination peak of the triglyceride tripalmitin (m.p = 67.316øC DSC run shown in Figure 2), and the fatty acid is palmitic acid (m.p = 63.866øC Figure 2). The peak for Mp-3 in C-16 can be assigned to the peak of the wax ester, palmityl palmitate (m.p = 55.166øC). Palmitoleic acid exists in the form of two isomers, •/(m.p = -18.7øC) and c• (m.p = 2.1øC) (13). Mp-2 can be a mixture of the unsaturated wax ester, oleyl oleate (m.p. = -4.234øC) and the c• form of palmitoleic acid. Mp-1 may be a mixture of the triglyc- eride tripalmitolein (m.p = -21.184øC) and the •/form of palmitoleic acid. Squalene has a m.p of -75øC and does not show any transitions. Its only role is probably that of a solvent, and it may be affecting all the peaks in decreasing their melting temperatures. Similarly, for the carbon chain lengths of 14 and 18, the peaks can be assigned to their individual components (DSC runs done separately, not shown here). In general, Mp-! is the peak of the unsaturated triglyceride and unsaturated fatty acid, Mp-2 is the peak of the unsaturated wax ester, Mp-3 is the peak of the saturated wax ester, and Mp-4 is the peak of the saturated triglyceride and fatty acid. It is safe to assign the peaks to this mixture of compounds as the individual compounds show their peaks around these melting transitions. In Figure 3, investigating C-14, an extra peak is seen before Mp-3. This can be attributed to a polymorphic form of one of the components. CARBON CHAIN LENGTH From Figure 4, it is obvious that as the carbon chain length increases, all the melting temperatures increase, which would be expected. The slopes of the unsaturated compo- -0.8 .• Mp-•p-4 C-16 • C-1 -50 -25 0 25 50 75 100 -Temperature (øC) Figure 3. Thermogram showing the effect of carbon chain length in the model sebum (ratio of unsaturation to saturation 1:1).

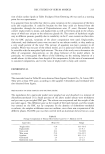
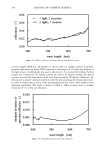
218 JOURNAL OF COSMETIC SCIENCE 70 to 50 o,• 4o • 30 =o • 10 :-=- o -20 -30 1 Mp-1 I I 12 14 16 18 20 Carbon Chain Length Figure 4. Effect of carbon chain length on the transition temperature (ratio of unsaturation to saturation 1:1). Error bars indicate the standard error of the mean of three replicates. nents are significantly smaller than the slopes of the saturated components, which means that the increase in carbon chain length affects the saturated portion more than the unsaturated portion. EFFECT OF PERCENT SATURATED The effect of saturation (corresponding to Table IV) on the melting temperatures is -10 3:1 2:1 1:1 1:2 1:3 0:1 -50 -25 0 25 50 75 100 Temperature (øC) Figure 5. Thermogram showing the effect of percent saturated in the model sebum for carbon chain length 16. Numbers on the side of thermograms indicate the ratio of unsaturation to saturation.
Purchased for the exclusive use of nofirst nolast (unknown)
From: SCC Media Library & Resource Center (library.scconline.org)