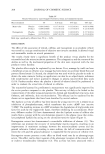
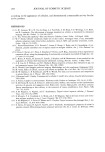
DEVICE TO MEASURE HAIR LUSTER 241 Figure 5. Range of measurement. to 50, were selected. Subjects with extremely bright hair (such as white or strongly bleached hair) were rejected. Measurement was performed in the order of (a) sensory evaluation, (b) measurement by the device, and (c) photography. The examination site of the sensory evaluation and device measurement was specified as the range from 5 to 10 cm of hair from the back of the head, as shown in Figure 5. After brushing, sensory evaluation based on the scoring method of the expert assessor was performed under ! incident light t9 i . cos • I cosO I ' irradiated face Figure 6. Correction of luminous intensity.

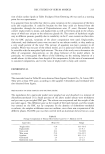
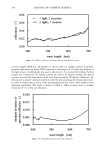
242 JOURNAL OF COSMETIC SCIENCE artificial illumination (SERIC Co., artificial solar light XC-100AF). The evaluation was rated with scores ranging from 1 to 7 (1: no luster 7: maximum luster), and also permitted the mean values (e.g., 1.5, 2.5) of an evaluating score. Both the surface brightness, including diffuse and specular compositions Ir and the diffuse composition Id, were changed to voltage by photodiodes, respectively, and then converted into "per unit" in an irradiation part. The potential difference of these was considered as the device output. RESULTS AND DISCUSSION VERIFICATION OF DRM IN HUMAN HAIR Since the irradiation area changes during measurement by the goniophotometric method when the receiving angle becomes large, the reflectance also increases, making the change unclear. The reflectance, which is converted into "per unit" in an irradiation part, is shown in Figure 6. The reflective characteristic of human hair, which is plotted in a three-dimensional graph, is shown in Figure 7. The peak of the receiving angle direction corresponds to the reflective characteristic of a specular reflective composition. The peak of the wavelength direction corresponds to the object's color, which is explained as a characteristic of a diffuse reflective composition. The difference between the reflectance in each receiving angle and its average value is shown in Figure 8. The standard deviation is shown in Figure 9. Since the reflectance was similar at all receiving angles, 0.20 0.15 0.10 0.05 0.00 -2O receiver angle [deg] 70 ,.•Oo Figure 7. 3D view of spectral reflectance. •o o
Purchased for the exclusive use of nofirst nolast (unknown)
From: SCC Media Library & Resource Center (library.scconline.org)