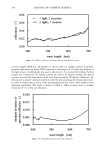
DELIVERY AND METABOLISM OF o•-TAc 231 o•-TAc AND o•-T ANALYSIS For the quantitative determination of o•-TAc and o•-T alone and in the presence of each other, HPLC analysis was used. By means of a Waters 717 autosampler, samples were taken from glass vials and injected into an HPLC apparatus. The latter consisted of a Waters 600 controller connected to a column (3.9 x 300 mm, p Bondapack RP C•s, Waters Corporation) and a variable wavelength detector (Waters 486 tunable absorbance detector) set at 285 nm. Chromatographic data were processed by a Waters 746 data module integrator. With acetonitrile (ACN):water (96:4) as the mobile phase (flow rate 1.4 ml/min), the retention times were 16 minutes for o•-TAc and 13 minutes for o•-T. The detection limits were 0.5 pg/ml (o•-TAc) and 0.25 pg/ml (o•-T). The HPLC method was validated prior to use, using USP standards. Limit of quantification, interday variability, and system suitability had been performed on the system previously. The peak areas were converted into concentrations (pg/ml) using a standard curve developed under conditions of Beer-Lambert's law. These were further converted into micrograms of compound using the dilution factor for each sample. The final results were expressed as percentage of applied dose. STATISTICAL DATA ANALYSES Microsoft Excel (1997) was used to compile and statistically analyze the data. Tukey's studentized range test was used to compare all the formulations to each other. The formulations were also compared to see how they fared against the simple solution. An F-test was done to estimate the interday variability. RESULTS All the formulations were found to be stable at room temperature for the three-week study period, as determined by HPLC. Particle sizes for the microemulsions are given in Table IV. HPLC chromatograms for the viable skin sample for each of the formulations showed two peaks, one at 13 minutes and the other at 16 minutes, identified as o•-T and o•-TAc, respectively, by standard o•-T and o•-TAc. Details of the spiking studies are given in our earlier publication (4). This was the order in which we had expected the peaks to elute, as we had used a reverse-phase HPLC column and o•-T is more polar than o•-TAc. Figure 1 shows the permeation profile for all the formulations in the study. This figure represents the amount of o•-TAc in the stratum corneum, o•-TAc in viable skin, and o•-T in viable skin. No o•-T was detected in the stratum comeurn. The quantities of o•-T and o•-TAc obtained in the receptor were below the limit of detection. The total amount permeated, which is the sum of o•-TAc and o•-T, in viable skin and the stratum corneum is depicted in Figure 2 (dark bars). As compared to the IPM solution, emulsion Table IV Particle Sizes for Microemulsions Formulation Diameter ñ SEM (nm) Emulsion 2 174.6 ñ 3.7 Emulsion 3 67.8 _+ 4.2

232 JOURNAL OF COSMETIC SCIENCE 25 20 15 10 5 0 [] 5tratum corneum [] alpha-TAc in viable Skin ß alpha-T in viable skin Figure 1. Permeation and metabolism of c•-TAc as a function of formulation. Values are percentage of applied dose, mean _+ SEM (n = 4). Emul 3 Emul 2 Emul 1 Gel 3 Gel 2 Gell lPM-solution 0 10 20 30 40 % Applied dose ß alpha-TAc and alpha-T in total skin [] alpha-TAc and alpha-T in viable skin Figure 2. Total amount oft•-TAc permeated (sum oft•-TAc and t•-T) in viable skin and total skin inclusive of stratum corneum. Values are percentage of applied dose, mean + SEM (n = 4). 2 had higher permeation in the stratum corneum, and this difference was statistically significant (Tukey's, u -- 0.05). Emulsion 2 also had significantly higher permeation as compared to the other biphasic formulations, viz., emulsion 1 and emulsion 3. The formulations were compared with respect to the amount of u-TAc alone in viable skin. All three emulsion systems had significantly higher permeation compared to the IPM solution but did not differ from each other. The gel formulations did not differ from each other either. The amount of metabolite (u-T) formed in the viable skin from emulsion
Purchased for the exclusive use of nofirst nolast (unknown)
From: SCC Media Library & Resource Center (library.scconline.org)