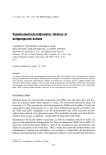
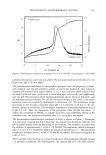
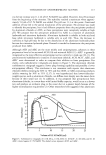
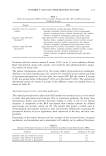
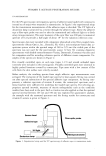
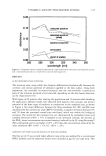
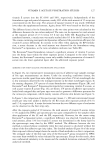
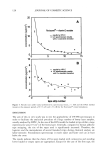
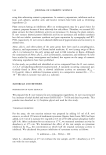
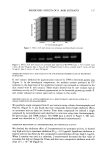
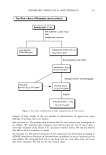
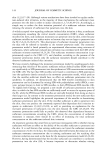
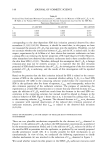
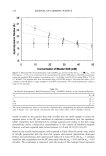
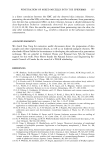
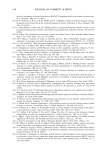
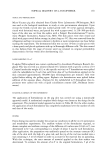
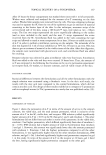
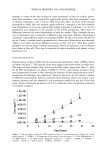
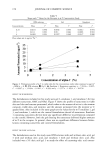
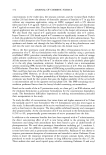
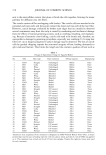
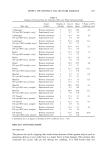
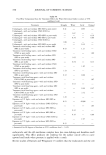
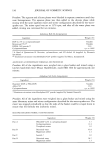
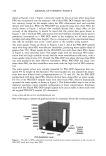
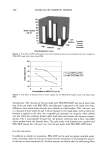
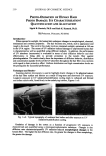
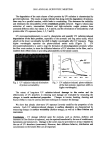
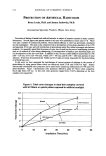
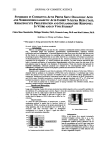
VITAMIN E ACETATE PENETRATION STUDIES 123 UV SPECTROSCOPY For the UV spectroscopic investigation, spectra of adhesive tapes loaded with corneocytes (second set of strips) were measured in transmission. In Figure 1 the experimental setup for the transmission measurements of the adhesive tapes is sketched. The UV light of a deuterium lamp is projected via a mirror through the adhesive tape. Above the adhesive tape a fiber-optic probe was used to take the transmitted and collected light to a diode array minispectrometer. The outer diameter of the optic fiber was 200 prn its numerical aperture of 0.22 provides a half angle of about 18 ø for the radiation collection cone. Spectroscopic data were recorded with a dispersive photodiode array fiber-coupled mini- spectrometer (Ocean Optics, Inc., Dunedin, FL) with a microcomputer-based data ac- quisition system within the spectral range of 260 to 525 nm (the visible part of the spectrum was not used for the spectrometric assay). A Cary 5G scanning dispersive spectrometer with double monochromator (Varian, Darmstadt, Germany) was also used for comparison and for recording reference spectra of different cream components. Ex- amples of the spectra are shown in Figure 2. Five visually controlled spots on each tape (tapes 1-15) and several unloaded tapes (controls) were included in the investigation. Visually controlled spots were identical to highly packed locations covered by corneocytes. Tape areas with a low content of fiat cells from the skin surface were strictly avoided. Before analysis, the resulting spectra from single adhesive tape measurements were averaged. The evaluation of the loaded tape spectra by least-squares fitting was carried out after spectral subtraction of the spectral adhesive tape component. As fitting com- ponents, a reference spectrum of vitamin E acetate, the corneocytes' spectrum, and a linear baseline were sufficient for modeling the loaded tape spectra. For selecting ap- propriate spectral intervals, measures of matrix orthogonality such as the condition number have been used in the past. Such a criterion was also applied so that the optimal spectral interval between 265 nm and 350 nm was exploited for quantitative analysis. An example with the measured spectrum and the fitting results for corneocytes and vitamin E acetate is given in Figure 3. Sensor head er-optic probe Adhesive tape I I•/•1• Deuterium lamp • • Minispectrometer Figure 1. Experimental setup used for UV spectroscopy of adhesive tapes in transmission mode.

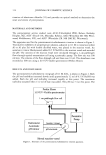
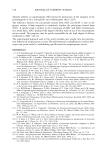
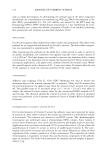
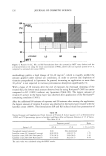
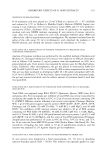
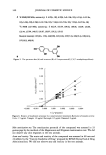
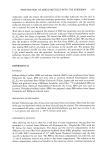
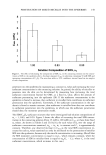
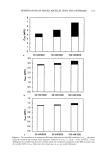
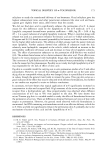
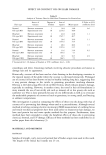
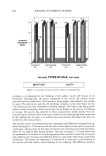
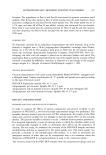
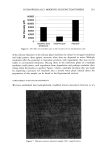
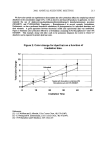
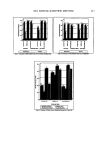
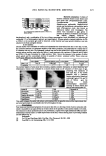
124 JOURNAL OF COSMETIC SCIENCE 0.3 0.2 0.1 o 250 1.5 A ............... Ocean Optics Cary 5G i i 300 350 400 • Roviparts © B x5 • 1- • 0.5- i•'.....-_ ....... lameliar cream '• ........... Rovisome 0- i i 250 300 350 400 5 )• Rovisome C 4- / •/•0% Vitamin E acetate • / ~ ,,' • Vitamin E acetate c 3 • / /" '"'i • •ovipa"s © ./'""- "'• '"..• ] + 10 % Vitamin E acetate ,•, '""% ...................................................?ill ..... i I 250 300 350 400 wavelength [nm] Figure 2. (A) Spectra of adhesive tapes measured by a minispectrometer (Ocean Optics) and a Cary 5G double monochromator spectrometer (the upper two spectra are offset for clarity). (B) Formulation com- ponents, (C) Rovisome ©- and Roviparts©-containinF= vitamin E acetate and pure vitamin E acetate.
Purchased for the exclusive use of nofirst nolast (unknown)
From: SCC Media Library & Resource Center (library.scconline.org)