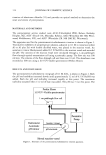
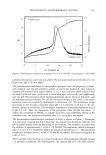
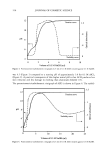
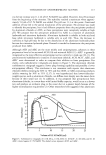
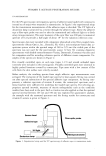
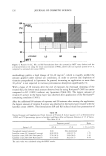
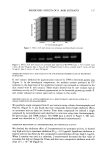
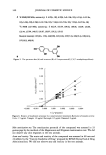
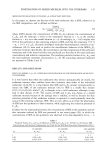
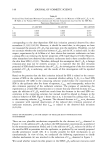
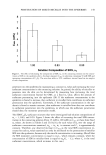
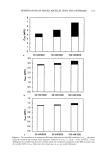
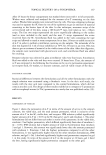
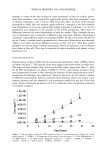
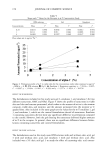
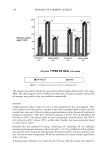
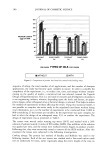
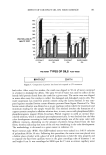
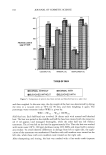
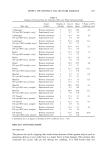
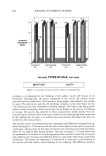
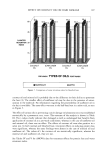
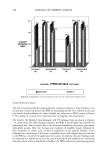
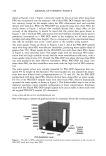
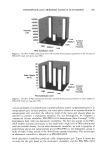
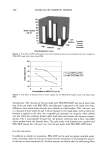
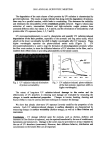
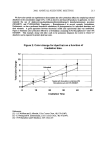
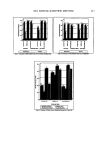
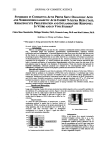
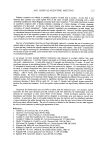
TOPICAL DELIVERY OF ot-TOCOPHEROL 167 After 24 hours the donor compartment was washed three times with 1 ml of acetonitrile. Washes were collected and analyzed for the amount of ot-T remaining on the skin surface. Washed skin samples were removed from the cells. The tape-stripping technique was used to separate the SC from the rest of the epidermis to get an estimate of material remaining in the barrier layer of the skin. In this technique, seventeen strips of the active-treated side of the skin, using a 3M Scotch TM tape, were taken as two + fifteen strips. The first two strips represented the active superficially adhering to the surface (and so were included in the wash) and the next 15 strips represented the active recovered from the SC. Scintillation fluid was added to the vials containing the tape strips and allowed to stand at room temperature for at least 24 hours to enable extraction of ot-T in order to perform scintillation counting on the samples. The remainder of the skin was digested in 3 ml of tissue solubilizer at 50øC for 24 hours in an oven. This was done to get an estimate of material in the viable tissues of the skin. After skin digestion, the samples were neutralized with glacial acetic acid, and scintillation fluid was added for counting. Receptor solution was collected in glass scintillation vials every four hours. Scintillation fluid was added to the vials and they were counted 24 hours later. Thus, the amount of ot-T was estimated in the following four locations in the in vitro permeation experiment: (a) receptor fluid, (b) washes, (c) stratum corneum, and (d) viable tissues of the skin. STATISTICAL ANALYSIS Statistical differences between the formulations and all the other formulations with the simple solution were estimated using a Student's t-test. In the oleic acid study, the results with the oleic acid were compared to the control formulations, which did not contain any oleic acid. The design of these studies enabled us to compare ot-T permeation with ot-tocopheryl acetate (ot-TAc) permeation in a study that was published earlier (19). RESULTS COMPARISON OF VEHICLES Figure 1 shows the permeation of ot-T in terms of the amount of active in the stratum corneum, the viable skin, and the total amount permeated, which is inclusive of the amount of ot-T in the SC, viable skin, and receptor. IPM solution yielded significantly higher amounts of ot-T (or = 0.05) in the SC than gels 1 and 2 and emulsion 1. The other formulations did not differ from each other in terms of this parameter. In the viable skin, emulsion 2 had higher permeation, which differed significantly from that of emulsion 3 (or = 0.05). IPM solution had a higher amount of total ot-T permeation than emulsion 3 and gel 1. However, this amount was significantly lower than the amount permeated with emulsion 2. Emulsion 2 had the highest permeation compared to all the other formulations. It was significantly higher than for the other emulsion formulations, IPM solution, and gel 1. Gel 3 also had significantly higher total permeation compared to gel 1 in this study. In terms of the amount of o•-T in the receptor at 24 hours, gel 3 fared the best, having significantly higher permeation compared to the other gels.

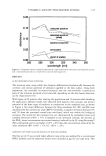
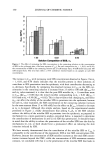
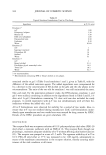
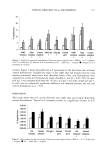
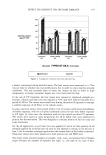
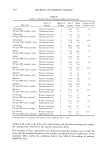
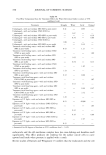
168 JOURNAL OF COSMETIC SCIENCE Figure 1. Effect of formulations on the skin delivery of t•-T. Values are percent applied dose + SEM (n = 4). I, Stratum corneum. B, Viable skin. [], Total amount permeated. l-q, Amount in receptor. Comparison oftx-T and tx-TAcpermeation. Results of ot-T permeation study were compared to ct-TAc permeation studies performed earlier (19). ct-TAc is a commonly used prodrug precursor of ct-T and it has to undergo metabolism by skin enzymes to release the active antioxidant, ot-T. Table IV shows the comparative values for the permeation in viable skin and receptor and total skin and receptor for ct-T and ct-TAc, as a function of the delivery system. ct-T permeation studies showed a lower permeation of active than the ct-TAc studies through all the parameters measured. To find the extent of this decrease, a ratio was taken of the average amount of ot-TAc permeated to the ot-T permeated. The amount of active permeated in viable skin and receptor in the ct-T permeation study was lower by about 2.22 times than the active that permeated from the ot-TAc permeation study. The ct-TAc permeation study had values about 2.98 times higher than the ct-T study when measured as total skin plus receptor, which is inclusive of the stratum corneum. Although the values obtained in studies using either ot-TAc or ot-T were numerically different, certain trends observed in both the studies remained the same. For Table IV Comparison of c•-T and c•-TAc Permeation at 24 Hours Viable skin + receptor (% applied dose) Total skin + receptor (% applied dose) Formulation cz-T cz-TAc cz-TAc/cz-T cz-T cz-TAc cz-TAc/cz-T IPM solution 9.74 + 0.89 15.93 -+ 2.18 1.64 3.17 + 0.49 6.66 + 1.27 2.10 Gel 1 6.47 + 0.54 17.54 + 4.79 2.71 2.24 _+ 0.24 8.73 -+ 3.19 3.89 Gel 2 6.62 _+ 1.26 9.99 + 0.95 1.51 3.16 + 0.88 6.42 _+ 0.26 2.03 Gel 3 8.55 + 0.55 19.69 -+ 2.28 2.30 3.42 + 0.37 9.65 -+ 1.10 2.82 Emulsion 1 6.72 _+ 1.4 16.02 + 4.27 2.38 3.46 _+ 1.22 9.85 -+ 1.98 2.85 Emulsion 2 12.24 _+ 0.98 31.67 + 5.87 2.59 5.83 -+ 0.77 15.22 + 2.27 2.61 Emulsion 3 6.95 + 1.28 16.82 + 4.97 2.42 2.30 _+ 0.32 10.49 _+ 3.10 4.56 Average 2.22 2.98 Values are percent applied dose _+ SEM (n = 4).
Purchased for the exclusive use of nofirst nolast (unknown)
From: SCC Media Library & Resource Center (library.scconline.org)