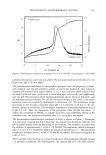
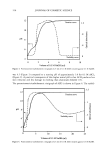
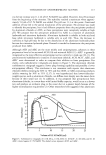
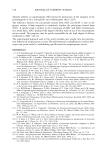
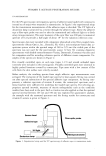
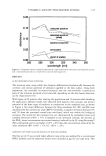
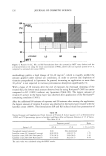
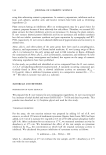
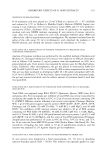
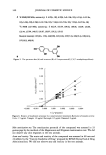
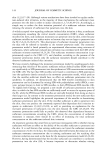
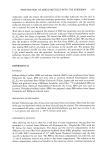
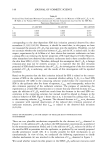
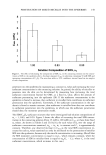
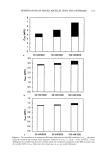
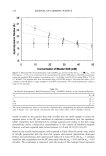
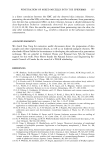
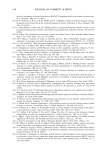
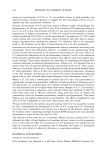
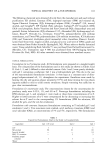
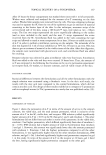
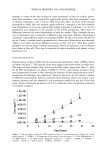
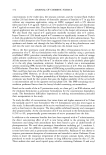
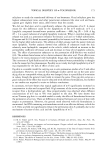
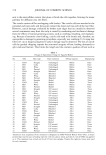
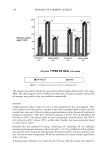
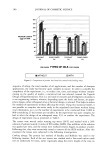
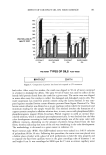
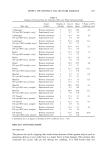
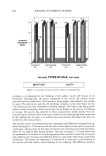
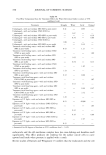
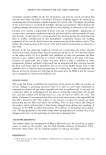
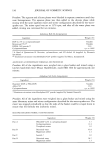
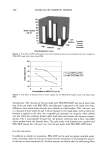
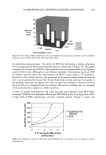
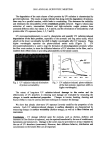
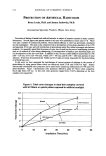
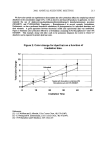
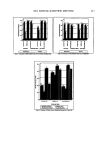
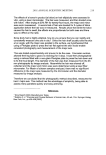
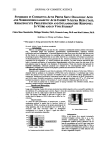
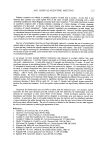
VITAMIN E ACETATE PENETRATION STUDIES 125 0.20 0.15 0.10 calculated spe•tru"•"'-'- --- •_.... (offset) baseline-component '-'•--•--._.. comeocytes • •••v•amin E acetate 2(i0 280 300 320 340 3130 wavelength [nm] Figure 3. Component spectra, measured spectrum of a tape loaded with corneocytes and vitamin E acetate, and a calculated spectrum as a result from a spectral least-squares fit. RESULTS ACTIVATION/IRRITATION POTENTIAL The irritation assay using whole skin biopsies differentiates biochemically between the cytotoxic and irritant potential of substances applied to the skin surface. Using both parameters, the reversible (activation/irritancy) and the non-reversible (cytotoxicity) parts of the irritation potential of test material, depending on the skin barrier function, can be characterized (1 1). With lapses of 60 minutes after starting the application and 30 minutes after finishing the application, different results were observed with regard to the cytotoxic and irritant potential of the three types of emulsion in comparison to the untreated area, as shown in Figure 4. No major differences between the three emulsions (LC, RP, and RS) were manifested by the cytotoxicity assay (MTT). Generally, a negative deviation between 6% and 7% from the untreated control sites was found, which was within the biological variation. The results for the untreated site are characterized by normalized mean and standard deviation (100% + 5%). Compared to the untreated controls, the increase of the PGE 2 tissue concentration (activation/irritancy) induced by the LC using Rovisome © (RS) as liposomal carrier was higher (119% + 8%) than the concentration induced by the other emulsions (RP: 110% + 3% LC: 105% + 2%). ADHESIVE TAPE STRIP ANALYSIS: RESULTS OF THE HPLC METHOD The first set of 15 successively taken adhesive tape strips was analyzed by a conventional HPLC method, and the analytical results were calculated as pg/cm 2 per tape strip. This

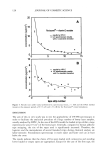
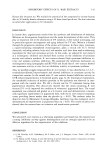
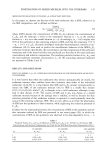
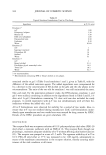
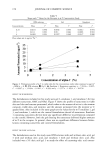
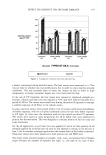
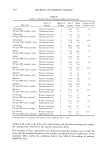
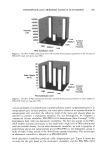
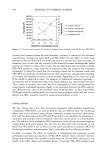
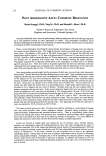
126 JOURNAL OF COSMETIC SCIENCE 120 - untreated LC RP RS eo J MTT Figure 4. Results for LC, RP, and RS formulations from the cytotoxicity MTT assay (below) and the activation/irritancy test using the tissue concentration of PGE 2 (above) after an exposure period of 0.5 h, compared to untreated skin areas (100%). methodology prefers a high dosage of 30-40 mg/cm 2, which is roughly tenfold the amount applied under normal use conditions, in order to prevent any depletion of vitamins encapsulated in liposomes. In general, increasing an application to more than 10 pl/cm 2 is not expected to increase percutaneous absorption significantly (3). With a lapse of 30 minutes after the end of exposure, by thorough cleansing of the treated skin, the lowest total amount observed was by using Roviparts © (58%) as carrier compared to LC (100%) without any liposomes (Table III). The largest amount of vitamin E acetate in the horny layer was observed after application of the Rovisome ©- containing emulsion (150%). After the additional 60 minutes of exposure and 90 minutes after starting the application, the largest amount of vitamin E acetate was observed in the horny layer treated with the lameliar cream (100%). The formulations RP and RS induced much less penetration of Table III Natural Amount and Supplemented Total Amount of Vitamin E Acetate (pg/per cm 2) as Determined by HPLC and UV Spectroscopy (given in brackets) and Ratio After an Exposure Duration of 1.5 h Versus That After 0.5 h Exposure period Ratio Strips 1-15 0.5 h 1.5 h 1.5 h vs 0.5 h Tocopherol (natural amount) LameIlar cream, LC (vitamin E acetate) Lameliar cream, RP (20% Roviparts ©) Lameliar cream, RS (20% Rovisome ©) 0.06 Not determined 30.0 (29.9) 34.6 (31.5) 1.15 17.6 (18.5) 24.0 (18.6) 1.36 45.4 (30.6) 20.2 (19.7) 0.44 The ratio value was calculated using the HPLC results.
Purchased for the exclusive use of nofirst nolast (unknown)
From: SCC Media Library & Resource Center (library.scconline.org)