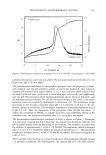
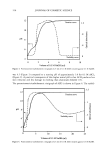
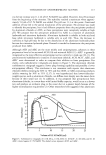
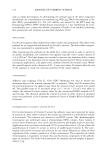
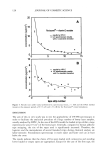
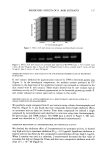
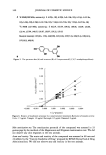
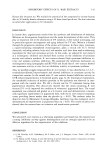
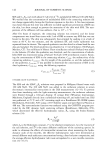
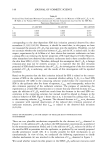
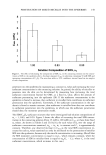
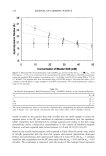
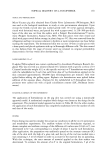
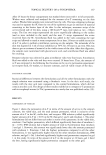
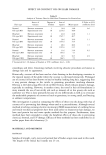
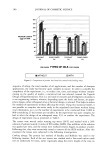
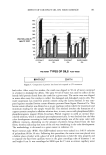
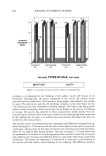
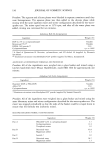
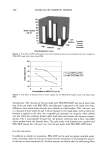
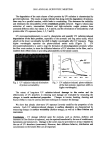
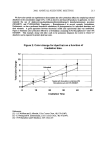
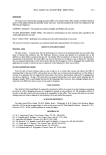
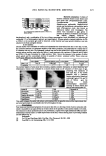
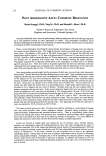
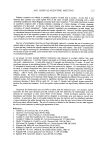
TOPICAL DELIVERY OF ot-TOCOPHEROL 169 example, in terms of the total amount of active permeated in both the studies, perme- ation from emulsion 2 was statistically significantly greater than from emulsions 1 and 3, whereas emulsions 1 and 3 did not differ from each other. In terms of the amount permeated in viable skin and receptor, again emulsion 2 emerged as the best formula- tion. Permeation of active was significantly higher compared to emulsion 3 in the ot-T permeation and compared to the solution in the ot-TAc permeation. There were no differences between the other formulations in both the studies. Thus, although the two sets of experiment were conducted at different times and under different experimental conditions, using different analytical techniques (HPLC for the ot-TAc assay and LSC for the ot-T assay), a similar trend in permeation as a function of formulation was observed. There is very little structural difference between ot-TAc and ot-T. They have similar lipophilicities and are devoid of functional groups, which can dissociate to give different ionic forms at skin pH. They may be expected to behave similarly with respect to skin penetration (7). CONCENTRATION STUDY Representative receptor profiles for the concentration dependency study of IPM solution are shown in Figure 2. The linearity of the plots suggests the achievement of steady state. The slopes of these straight lines, which are the flux values, along with their r 2 values for all three formulations, are shown in Table V. As the concentration increased, there was a proportional increase in flux, showing the existence of dose proportionality for ot-T permeation. Interestingly the permeation values for the active in the stratum corneum at different concentrations showed a deviation from linearity, which was unique to the stratum corneum and not observed in the permeation profiles for the rest of the skin tissue. Figure 3 shows the permeation of ot-T in viable skin when the amount permeated was plotted as pg/cm 2. 1.4E+00 1.2E+00 1.0E+00 8.0E-01 6.0E-01 4.0E-01 2.0E-01 O.OE+00 0 5 10 15 20 25 30 Time (hours) Figure 2. Plot of receptor profiles for IPM solution in the ot-T concentration study. Values are concen- tration (pg/cm -2) + SEM (n = 4). Equations of the straight lines are shown. O, 0.25% IPM solution. [•, 1% IPM solution. /•, 4% IPM solution. Regression equations: y = 0.0033x - 0.0084, r 2 = 0.9899 y = 0.0146x - 0.0242, r 2 = 0.9919 and y = 0.0485x - 0.0946, r 2 = 0.993.

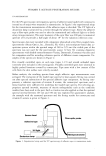
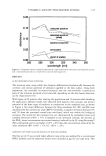
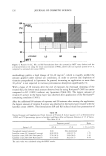
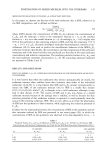
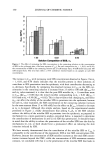
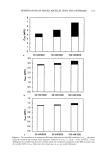
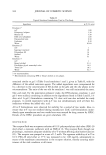
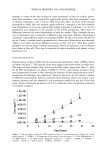
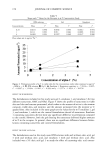
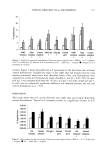
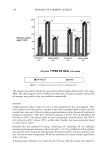
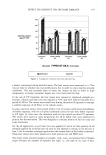
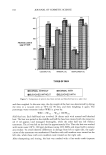
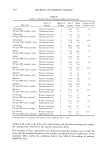
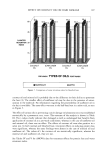
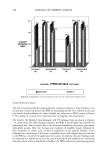
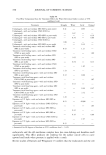
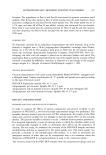
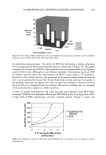
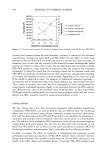
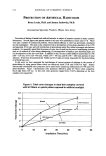
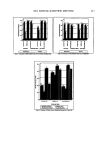
170 JOURNAL OF COSMETIC SCIENCE Table V Slopes and r 2 Values for the Receptor in o•-T Concentration Study IPM solution Gel Emulsion Concentration Flux r 2 Flux r 2 Flux r 2 0.25 0.0033 0.990 0.0041 0.999 0.0012 0.994 1 0.014 0.992 0.011 0.984 0.0065 0.993 4 0.0485 0.993 0.0397 0.960 0.0327 0.980 Flux values are in pg/cm-2hr -1. 35- 30 20 0 1 2 3 4 Concentration ofalpha-T (%) Figure 3. Permeation profile of o•-T in viable skin for the concentration study when expressed as pg/cm 2 + SEM (n = 4). ', IPM solution. l, Gel 3. ', Emulsion 3. Regression equations: y = 7.9944x + 0.0225, 2 = 0.999 and y = 1.3517x + 1.2034, r 2 = 0.8756. r = 0.9997 y = 3.2494x + 0.1042, r 2 EFFECT OF SUNSCREENS The formulations included in this study were gel 3, emulsion 1, and emulsion 3 for two different sunscreens, OMC and OSal. Figure 4 shows the profile of sunscreens in viable skin and the total amount permeated, which refers to the amount of active in the stratum corneum, viable skin, and receptor, and the amount permeated into the receptor as % applied dose. Also included in the same graph are the values for the c•-T emulsion 1, gel 3, and emulsion 3, which are the control formulations devoid of sunscreens. Emulsion 1 containing sunscreens did not show any significant difference in permeation compared to the control. However, both the gels bearing the sunscreens delivered higher amounts of c•-T in the receptor. In general, there was no significant difference between formu- lations containing sunscreens and control formulations. EFFECT OF OLEIC ACID (OA) The formulations used in the study were IPM solution with and without oleic acid, gel 3 with and without oleic acid, and emulsion 1 with and without oleic acid. Also included was a 5% oleic acid gel 3 to study the effect of increasing oleic acid concen-
Purchased for the exclusive use of nofirst nolast (unknown)
From: SCC Media Library & Resource Center (library.scconline.org)