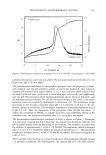
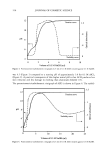
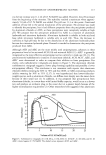
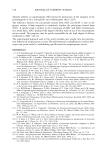
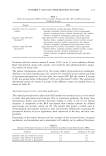
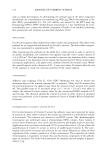
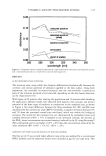
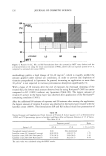
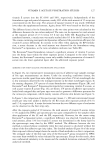
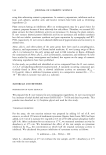
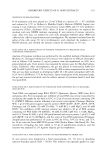
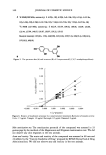
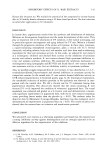
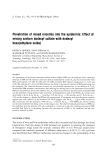
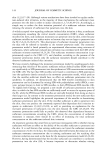
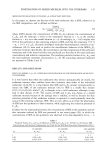
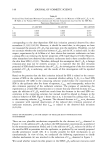
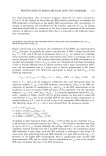
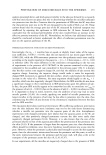
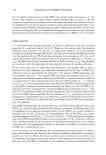
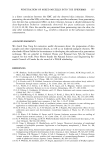
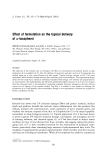
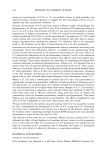
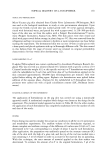
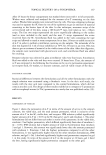
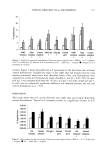
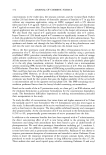
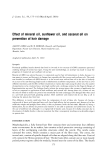
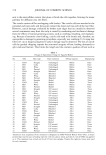
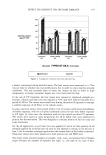
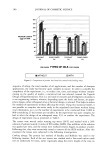
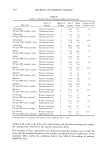
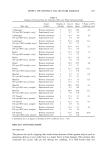
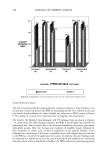
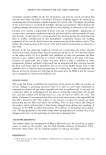
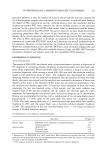
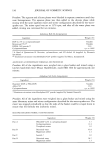
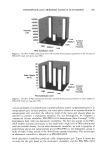
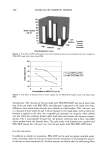
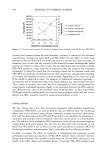
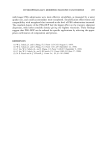
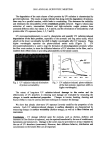
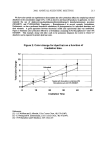
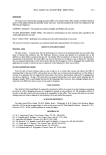
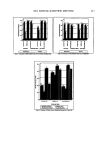
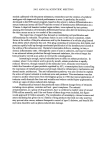
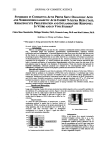
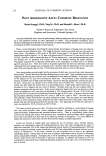
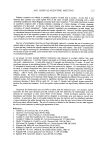
TITRATION OF ANTIPERSPIRANT ACTIVES 115 12 10 pH 6 4 Titration curve Turbidity curve 0 5 10 15 20 25 _ 1.5 0.5 N NaOH, ml Figure 2. Potentiometric/turbidometric titrigraph of 25 ml of 0.1 M A1CI• titrated against 0.5 N NaOH. turbidity decreased as more base was added. The precipitate had dissolved when 19.2 ml of the base (pH 11.6) was added. The potentiometric/turbidometric titrigraph is consistent with the properties of alumi- num chloride and the pH-solubility profile of aluminum hydroxide. The relatively constant pH observed until approximately 12 ml of base had been added indicates that the added hydroxyls were coordinated to aluminum ions and thus did not significantly raise the pH. Polymerization of the hydroxy-aluminum species began at this point, and the turbidity increased sharply. The pH also increased sharply at this point, as the added hydroxyls were not completely coordinated to aluminum (13). The dissolution of the precipitate as the titration proceeded above pH 7.4 is believed to be due to the am- photeric nature of aluminum. The minimum solubility of aluminum hydroxide occurs at pH 5.8 (14). Thus, the dissolution of the precipitate when the pH was above 7.4 reflects the conversion of AI(OH 0 to soluble aluminate anion (AI(OH)•). Based on the turbidity curve, the precipitate dissolved after 19.2 ml of base was added. The potentiometric/turbidometric titrigraph of ACH is shown in Figure 3. Formation of a precipitate required much less base than was required for aluminum chloride. The pH increased sharply from the beginning of the titration. The turbidity increased after the addition of approximately 1 ml of 0.5 N NaOH. The maximum turbidity occurred when 4.0 ml of 0.5 N NaOH was added. At this point, the pH was 11.7. The precipitate completely dissolved after 6.3 ml of 0.5 N NaOH was added. This point corresponds to a pH of 12.0. ACH required much less base to initiate precipitation than aluminum chloride because it is partially neutralized (10). Consequently, the starting pH of 0.! M ACH solution

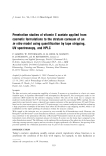
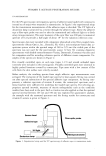
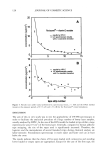
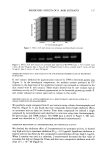
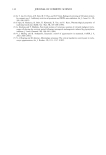
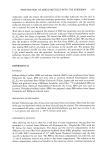
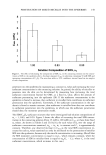
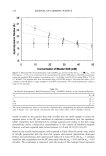
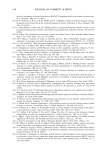
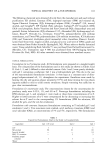
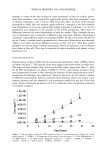
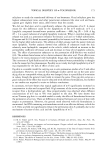
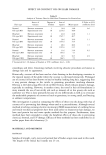
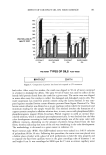
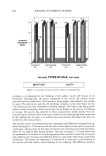
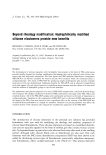
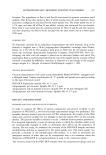
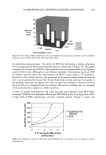
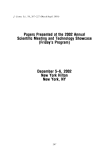
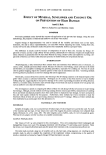
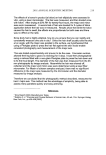
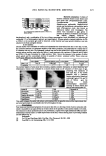
116 JOURNAL OF COSMETIC SCIENCE 12 10 pH 8 6 Turbidity curve 0 2 4 6 8 10 Volume ofO.5 M NaOH (ml) 1.2 Figure 3. Potentiometric/turbidometric titrigraph of 25 ml of 0.1 M ACH titrated against 0.5 N NaOH. was 4.5 (Figure 3) compared to a starting pH of approximately 3.0 for 0.1 M AICI 3 (Figure 2). A practical consequence of this higher initial pH is that ACH produces less skin irritation and less damage to clothing than aluminum chloride (15). The potentiometric/turbidometric titrigraph of AZG is shown in Figure 4. The turbid- pH 8 12- 10' Titration curve % % % Turbidity curve 0 5 10 15 0 25 - 1.5 1 Volume of 0.5 M NaOH (ml) Figure 4. Potentiometric/turbidornetric titrigraph of 25 ml of 0.1 M AZG titrated against 0.5 N NaOH.
Purchased for the exclusive use of nofirst nolast (unknown)
From: SCC Media Library & Resource Center (library.scconline.org)