PREPARATION OF LIPOSOMES LOADED WITH AVO AND AR 11 spectrophotometer (Hitachi, Japan). Calibration curves using 95% ethanol or methanol as the solvent were subsequently used for quantifying AR and AVO in the liposomes and the compartments of the in vitro permeation assembly, respectively. PREPARATION OF LIPOSOMES AR and AVO were encapsulated in the liposomes by the thin fi lm hydration and/or re- versed phase evaporation method. The initial step for either method is similar and in- volves the formation of layered lipid fi lm. Thin fi lm hydration method. (a) Lipo-AVO: 10–20 μmol EPC was fi rst dissolved in 100– 200 μl chloroform containing 125 μg/ml AVO. After evaporating chloroform, the mix- ture formed a thin fi lm at the bottom of the test tube. The fi lm was then hydrated in 1 ml of 0.9% NaCl by vortexing the dispersion at 37°C for 3 min. (b) Lipo-AR-AVO: 10–20 μmol EPC was fi rst dissolved in 100–200 μl chloroform containing 125 μg/ml AVO. After evaporating chloroform, the mixture formed a thin fi lm at the bottom of the test tube. The fi lm was then hydrated in 1 ml of AR stock solution in 0.9% NaCl by vortexing the dispersion at 37°C for 3 min. (c) Lipo-AR: 10–20 μmol EPC was fi rst dis- solved in 100–200 μl chloroform. After evaporating chloroform, the mixture formed a thin fi lm at the bottom of the test tube. The fi lm was then hydrated in 1 ml of AR stock solution in 0.9% NaCl by vortexing the dispersion at 37°C for 3 min. Reverse-phase evaporation method. (a) Lipo-AVO: 10–20 μmol EPC was fi rst dissolved in 100– 200 μl chloroform containing 125 μg/ml AVO. After evaporating chloroform, the mixture formed a thin fi lm at the bottom of the test tube. The dry lipid fi lm was then redissolved in 1 ml of diethyl ether to which 1 ml of 0.9% NaCl solution was added. A stable emulsion was created by vortexing the mixture for 5 min at 37°C. The liposome solution was subse- quently formed by slowly removing diethyl ether using a rotary evaporator. (b) Lipo-AR- AVO: 10–20 μmol EPC was fi rst dissolved in 100–200 μl chloroform containing 125 μg/ml AVO. After evaporating chloroform, the mixture formed a thin fi lm at the bottom of the test tube. The dry lipid fi lm was then redissolved in 1 ml of diethyl ether to which 1 ml of AR stock solution in 0.9% NaCl solution was added. A stable emulsion was created by vortex- ing the mixture for 5 min at 37°C. The liposome solution was subsequently formed by slowly removing diethyl ether using a rotary evaporator. (c) Lipo-AR: 10–20 μmol EPC was fi rst dissolved in 100–200 μl chloroform. After evaporating chloroform, the mixture formed a thin fi lm at the bottom of the test tube. The dry lipid fi lm was then redissolved in 1 ml of diethyl ether to which 1 ml of AR stock solution in 0.9% NaCl solution was added. A stable emulsion was created by vortexing the mixture for 5 min at 37°C. The liposome solution was subsequently formed by slowly removing diethyl ether using a rotary evaporator. For all liposome preparations, untrapped AR and AVO were removed by size-exclusion chromatography using Sephadex G-50 column. The fi nal liposome preparations were stored at 4°C, unless otherwise specifi ed. CHARACTERIZATION OF LIPOSOMES Vesicle size and distribution was measured by dynamic light scattering using Coulter N4 Plus submicron particle size analyzer (Beckman Coulter, Irvine, CA). The amount of AR

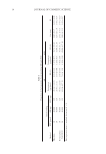
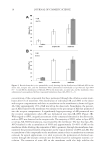
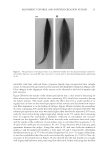
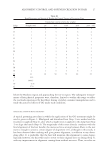
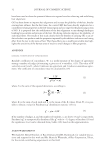
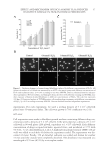
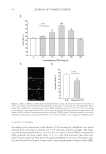
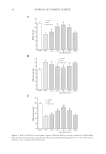
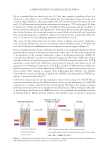
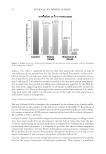
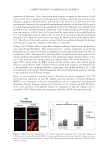
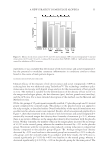
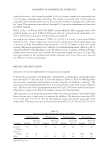
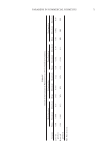
JOURNAL OF COSMETIC SCIENCE 12 and/or AVO encapsulated in the liposomes was determined by monitoring the absorbance of AR and AVO after disrupting the liposomes with 95% ethanol. Reference standards (free AVO and AR) were measured using the same processing conditions. The fi nal con- centration of liposomes was determined using the phosphate assay (11), which was sub- sequently used to calculate the EE(%) as follows: f i EE(%) P Lfu100 P Li where EE is the entrapment effi ciency, Li and Lf are the initial and recovery concentra- tions of phosphate, respectively, and Pi and Pf are the initial and recovery concentrations of drugs (AR or AVO, measured in micrograms), respectively. IN VITRO PERMEATION STUDY Franz diffusion cells were used to evaluate the in vitro permeability of AVO and AR across a cellulose acetate membrane with an average pore size of 2.0 μm. The donor chamber was loaded with 500 μl of the liposome formulations, whereas the receptor chamber contained 0.9% NaCl solution. The receptor chamber was stirred using a magnetic bar at 500 rpm and maintained at 37 ± 0.5°C using a circulating water bath system. At predetermined time intervals, 600 μl samples were withdrawn from the receptor chamber, diluted with fresh media, and analyzed spectrophotometrically for AVO and AR. RESULTS AND DISCUSSION SPECTRAL ANALYSIS OF AR AND AVO The absorption spectra of various concentrations of AR and AVO solutions are shown in Figure 1. Maximal absorption was found to be at 285 and 358 nm for AR and AVO, re- spectively. A linear correlation between absorbance and concentration was obtained with an r2 = 0.9998 and 0.9995 for AR and AVO, respectively. To identify potential interfer- ences between AVO and AR after their coencapsulation in the liposomes, the absorption spectra of various concentrations of AR in the presence of AVO and EPC were evaluated (Figure 1C). Although a general increase in AR absorbance was observed in the presence of AVO and EPC, a linear relationship between the concentration and absorbance was maintained and used for the quantifi cation of AR. CHARACTERIZATION OF THE FORMULATIONS The entrapment and EE of AR and AVO in the liposomes that were prepared by either the thin fi lm hydration or the reverse-phase evaporation methods are given in Table I. In the thin fi lm hydration method, increasing the concentration of EPC in the liposomes resulted in a decrease in the entrapment of AR and AVO. The highest EE of AR and AVO were only 1.0%
Purchased for the exclusive use of nofirst nolast (unknown)
From: SCC Media Library & Resource Center (library.scconline.org)