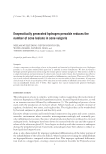
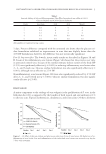
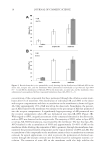
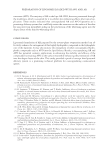
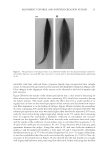
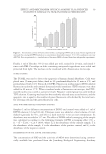
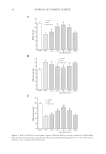
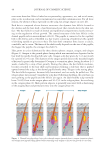
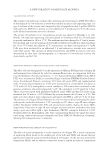
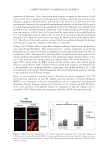
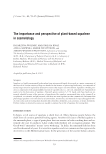
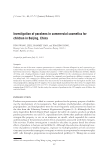
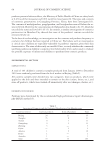
PREPARATION OF LIPOSOMES LOADED WITH AVO AND AR 13 Figure 1. (A) Absorption spectra of AR in 95% ethanol with AR concentrations ranging from 12.5 to 200 μg/ml. The linear relationship between the absorbance at 285 nm versus concentration is shown in the inset. (B) Absorption spectra of AVO in 95% ethanol, with AVO concentrations ranged from 1.25 to 20 μg/ml. The linear relationship between the absorbance at 358 nm versus concentration is shown in the inset. (C) Absorp- tion spectra of AR in 95% ethanol in the presence of AVO and EPC. Here, 7.5 μg/ml AVO and 0.5 μmol EPC were added to the AR solutions. AR concentrations ranged from 12.5 to 200 μg/ml. The linear relation- ship between the absorbance at 285 nm versus concentration is shown in the inset.

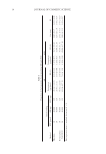
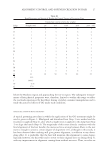
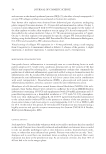
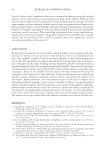
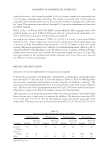
JOURNAL OF COSMETIC SCIENCE 14 Table I Properties of the Liposomes Coencapsulating AR and AVO Method Initial loading AR AVO Size (nm) PI Entrapment (μg/μmol) EE (%) Entrapment (μg/μmol) EE (%) EPC (μmol) AR (μg) AVO (μg) Thin fi lm 10 40,000 125 26.34 ± 12.65 0.65 ± 0.32 7.47 ± 0.73 59.72 ± 5.82 148.5 ± 6.7 0.62 ± 0.08 20 40,000 125 20.61 ± 1.52 1.03 ± 0.08 3.29 ± 0.14 52.68 ± 2.29 124.4 ± 12.0 0.55 ± 0.07 Reverse-phase evaporation 10 40,000 125 66.52 ± 21.60 1.66 ± 0.54 7.90 ± 2.85 76.39 ± 1.31 235.1 ± 33.3 0.47 ± 0.19 20 40,000 125 143.14 ± 27.76 7.16 ± 1.39 4.26 ± 1.09 68.16 ± 17.50 198.9 ± 33.5 0.43 ± 0.17 Data represent mean ± standard deviation ( N = 3).
Purchased for the exclusive use of nofirst nolast (unknown)
From: SCC Media Library & Resource Center (library.scconline.org)