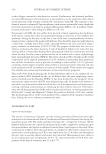
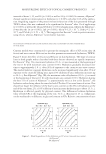
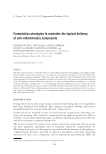
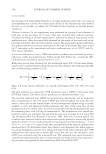
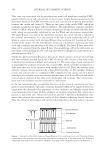
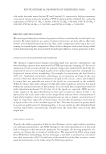
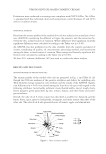
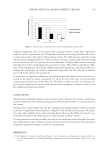
MOISTURIZING EFFECT OF TOPICAL COSMETIC PRODUCTS 333 volar forearm. Since measurement of water evaporation from the skin is signifi cantly re- lated to the temperature of the skin cover, the environment, and the probe, measurements were carried out 15 times, with the fi rst fi ve values not included in the calculation of the arithmetic mean. STATISTICAL DATA PROCESSING Calculating statistical data and creating graphical outputs were conducted using Excel 2010 and Statgraphics 6.0 (Manugistic, Inc., Rockville, MD). All the measured data were transferred to the database. Arithmetic means and standard deviations (SD) were calculated for the values obtained via corneometric measurement. Average hydration values acquired after pretreating the skin using SLS were subtracted from the mean CP hydration values, thus achieving the same initial conditions for each volunteer. Arithme- tic means and SDs were calculated using the primarily obtained TEWL data as well. The baseline was the time prior to the actual action of applying each CP to the test areas of the volar forearms on the right and left sides of each participating volunteer. The analysis of variance (ANOVA) factor evaluation was used for CP application at each time (1, 2, 3, 4, 24, 25, and 26 h) and the mutual interactions of these. The signifi cance level of 5% ( p 0.05) was chosen for statistical analysis. An F-test was carried out to discern the effects of CP containing 10% urea as declared against the control untreated area. Figure 1. A diagram describing the tested area with CP application to the volar forearms on the left and right hands.

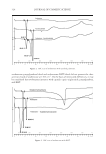
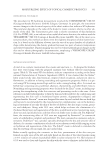
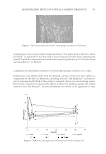
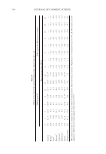
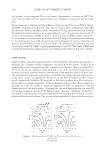
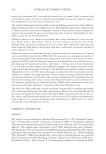
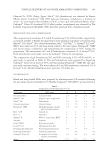
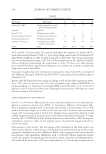
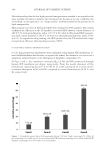
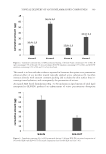
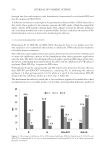
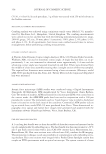
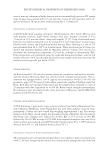
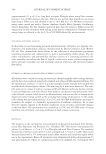
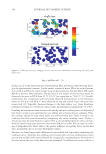
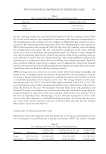
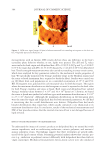
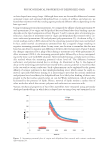
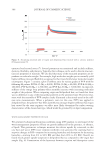
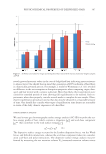
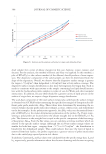
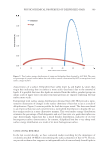
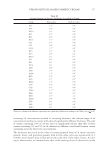
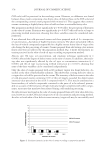
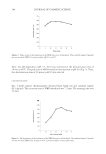
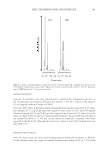
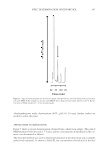
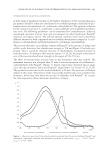
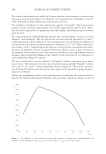
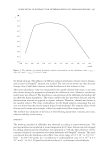
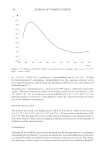
JOURNAL OF COSMETIC SCIENCE 334 RESULTS AND DISCUSSION COMPARISON OF THE HYDRATION EFFECTS OF THE TESTED CP AND OINTMENT BASE Skin hydration was measured on pretreated skin, with the period within 24 h of applica- tion selected as a decisive interval for diagnosis of the action. The observed hydration ef- fect for each CP was comparable (Fig. 2): Beline® 12.7 ± 6.5 c.j., Ziaja® 11.9 ± 7.4 c.j., Eucerin® 13.5 ± 7.7 c.j., Allpresan® 13.9 ± 7.2 c.j., DiabeCare® 15.3 ± 7.0 c.j., and Scholl® 16.5 ± 8.3 c.j. In contrast, the value of hydration shown for the ointment base without active hydration ingredients was at the level of pretreated skin. The negative hydration values for Scholl® just after application corresponded to the impenetrable fi lm that it created and the imperfect penetration of the cream into the epidermis. The evi- dence of the occlusive fi lm is shown in Fig. 3. COMPARISON OF TEWL WITHIN THE AREAS OF APPLICATION OF THE CP AND THE OINTMENT BASE The results of TEWL measurement (Fig. 4 Table II) of the untreated control area exhib- ited a slight decrease over the measured time intervals compared with the baseline. When comparing the control area to those with the CP applied, a decrease was shown in TEWL values at the measurement times of 1, 2, 3, 4, 24, and 25 h, i.e., a positive effect of the products used on skin barrier function. The highest negative differences found were those after 4 h of exposure to CP, for Beline®, Ziaja® and DiabeCare® creams, and the Allpresan® foam. As regard the ointment base, the same was found after 4 and 25 h of its action on the skin. The Scholl® cream was found to have increased the TEWL value within 1, 3, and 26 h of action compared to the control surface. Values expressing an occlusive effect of the tested CP were reported only for the Scholl® cream and the ointment base used. For the Figure 2. Corneometric measurements of skin hydration.
Purchased for the exclusive use of nofirst nolast (unknown)
From: SCC Media Library & Resource Center (library.scconline.org)