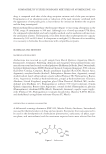
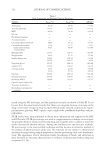
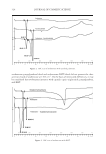
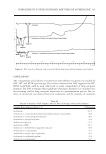
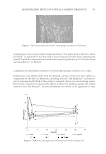
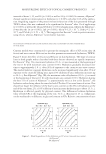
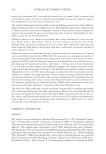
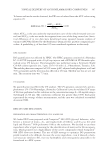
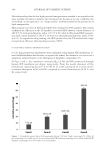
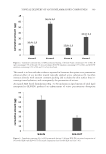
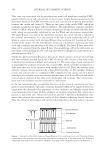
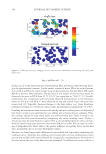
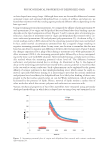
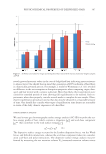
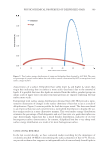
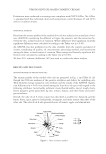
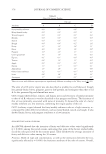
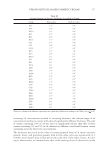
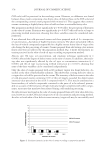
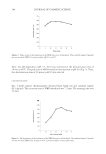
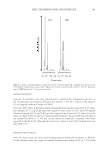
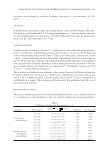
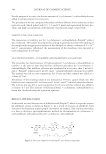
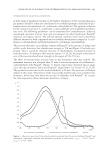
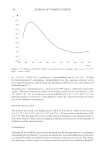
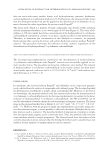
PHYSICOCHEMICAL PROPERTIES OF DELIPIDIZED HAIR 363 the dry combing analysis we examined several regions of the dry combing curves (Table II). In our initial analysis, we compared the maximum peak intensity corresponding to the entanglement peak in which case dry combing of delipidized hair resulted in an in- crease over fi ve times greater than virgin hair. The total combing work is also reported in Table II and represents the integrated values for the entire dry combing curves including the entanglement peak region. We also examined the integrated values of dry combing curves up to, but not including, the entanglement peak. In addition, we also integrated only the entanglement peak region. Overall, all portions of the drying combing curve are more diffi cult to comb in the case of delipidized hair. The smallest difference between the two hair types is in the region up to, but not including, the entanglement peak. Typically, this is the most diffi cult region of the combing curve to differentiate. Please bear in mind that the data reported are statistically signifi cant and represent averages of fi ve hair tresses combed fi ve times for both wet and dry combing analysis. AFM investigations were carried out in contact mode while monitoring topography and lateral forces. A striking feature we found in delipidized hair was the presence of many micropores. Figure 4 provides a representative example on solvent-extracted hair in which a considerable population of micropores can be seen. The average diameter of the pores was determined to be 150 ± 25 nm with their depth estimated to be 8.0 ± 2.5 nm. The pore depth may be greater than the measured value because of limitations of the probe to reach the bottom of the pore. We examined four hair fi bers from each population and obtained 25 images at randomly selected positions along the hair shaft. In virgin hair, we found micropores in only 21% of the sites examined, whereas they were present 70% of the time in delipidized hair. Interestingly, we also observed micropores in 42% of the cases for hair that underwent a standard bleaching procedure. It is likely that the pores are a part of the natural anatomic structure of the hair fi ber and only become revealed when surface lipids are removed (10). HEALTH STATE OF INTERNAL HAIR STRUCTURE Information about the importance that free lipids play in the structural properties of hair was investigated using differential scanning calorimetry (DSC) and tensile strength Table I Wet Combing Work Values for Virgin and Delipidized Hair Hair type Combing work (g cm) Virgin 0.061 ± 0.0071 Delipidized 0.325 ± 0.0450 Table II Dry Combing Work Values for Virgin and Delipidized Hair Hair type Peak max (g) Combing work (g cm)—total Combing work (g cm)—up to but not including peak Combing work (g cm)—peak Virgin 106.24 ± 11.52 0.028 ± 0.0027 0.017 ± 0.0018 0.011 ± 0.0010 Delipidized 559.48 ± 95.02 0.065 ± 0.0066 0.0276 ± 0.0025 0.038 ± 0.0050

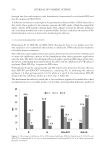
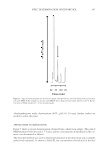
JOURNAL OF COSMETIC SCIENCE 364 measurements with an Instron. DSC results did not show any difference in the hair’s crystalline phase behavior whether, or not, lipids were present. The ΔH and Td values were similar for both virgin and delipidized hair: ΔH = 22.99 ± 0.49 J/g and Td = 142.86 ± 0.19° C for virgin hair and ΔH = 22.33 ± 0.83 J/g and Td = 142.46 ± 0.20° C for delipidized hair. Tensile strength measurements were also carried out resulting in stress–strain curves, which were analyzed for key parameters related to the mechanical tensile properties of hair. We specifi cally monitored the Young’s modulus (slope in the Hookean region) and the stress at break (maximum force required to break the fi ber). Studies were carried out on 100 fi bers from each population set in a controlled environment of 25° C and 45% RH. Histograms were generated for each measured value for both hair types. The region where the maximum distribution on the histogram occurred is reported as the fi nal value for both Young’s modulus and stress at break. Both virgin and delipidized hair yielded Young’s modulus values between 5 × 10¹⁰ and 10 × 1010 dynes/cm2. Likewise, we found the stress at break was similar for both hair types with maximum distributions at 2 × 10⁸ to 2.5 × 10⁸ dynes/cm2. Although the maximum distributions in the histogram plots were the same for virgin and delipidized hair for both measured parameters, we did fi nd it interesting that the overall distributions were distinct. Delipidized hair had much broader distributions than virgin hair, which usually contained a very sharp peak at its maximum distribution value. In conclusion, results of the mechanical measurements and DSC of hair provide evidence that the internal structure of hair is not damaged because of lipid removal. EFFECTS OF HAIR TREATMENTS ON DELIPIDIZED HAIR To understand the impact of cosmetic products on delipidized hair, we treated hair with various ingredients, such as conditioning surfactants, cationic polymers, and nonionic/ anionic polymeric resins. Our fi ndings suggest that these treatments are greatly infl u- enced by the lipid content of hair. Streaming potential analysis shows that cationic spe- cies (e.g., surfactant or polymer) interact differently with delipidized hair than with its virgin counterpart. Mechanical measurements (stress–strain curves) were also conducted Figure 4. AFM error signal image (10 μm) of solvent-extracted hair revealing micropores on the hair sur- face. Originally appeared in Reference 9.
Purchased for the exclusive use of nofirst nolast (unknown)
From: SCC Media Library & Resource Center (library.scconline.org)