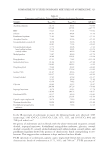
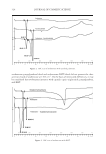
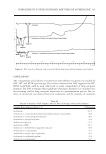
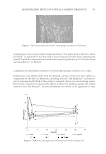
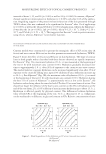
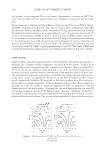
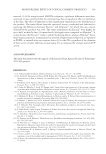
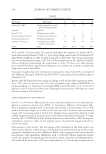
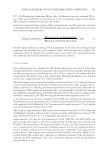
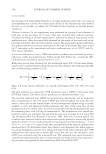
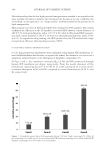
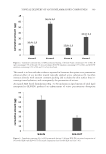
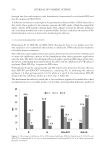
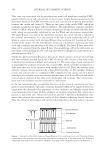
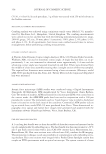
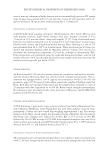
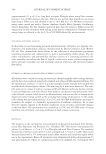
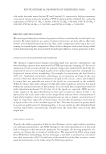
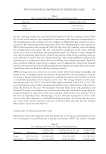
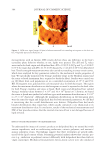
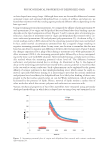
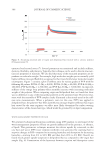
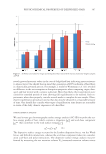
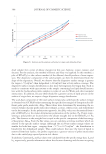
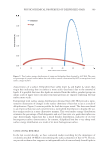
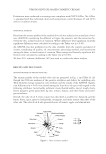
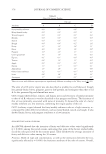
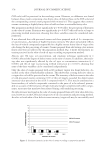
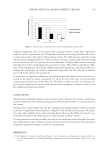
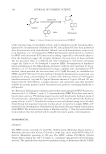
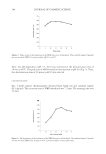
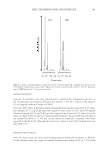
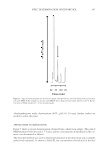
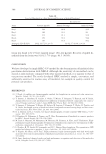
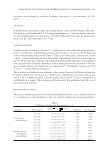
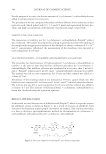
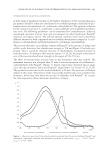
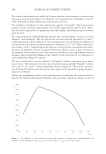
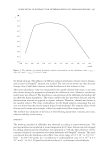
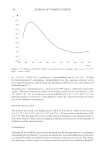
COMPATIBILITY STUDIES IN BINARY MIXTURES OF AVOBENZONE 321 RESULTS AND DISCUSSION The thermal behavior of the pure drug, respective excipient, and the combination of drug and excipient is compared in the DSC thermograms. The thermogram of avobenzone showed an endothermic peak at 86.4°C (corresponding to its melting point) with an as- sociated enthalpy of −75.01 J/g. DRUG–EXCIPIENT COMPATIBILITY TESTING In a majority of the cases, melting endotherm of the drug was well preserved with slight changes in terms of broadening or shifting toward a lower temperature. It has been re- ported that the quantity of material used, especially in active–excipient mixtures, affects the peak shape and enthalpy (33). Thus, these minor changes in the melting endotherm of a drug could be attributed to the mixing of active and excipient, which lowers the purity of each component in the mixture and may not necessarily indicate potential in- compatibility (31). Variations in the enthalpy values for the binary mixtures can be at- tributed to some heterogeneity in the small samples used for the experiments (3–4 mg) (22). The enthalpy values are reduced to half, less the binary mixtures mentioned. DSC data of avobenzone and excipient thermal events in single or binary systems are presented in Tables I and II. The melting endotherm of avobenzone was well retained in the blends of avobenzone with silicone, imidazolidinyl urea, sorbitol 70%, ascorbyl pal- mitate (Figure 2), propylene glycol, titanium dioxide/silica, and disodium EDTA. In the DSC scan of avobenzone with acetylated lanolin or methyl p-hydroxybenzoate (Methyl- paraben), the peak of avobenzone shifted to a lower temperature and broadened. There was also a signifi cant reduction in the enthalpy value. In the DSC scan of avobenzone with cetearyl alcohol, isopropyl myristate, propyl p-hydroxybenzoate (Propylparaben), diethylhexyl syringylidene malonate, caprylic capric triglyceride, BHT (Figure 3), cetearyl alcohol/ceteareth 20, cetearyl alcohol/sodium lauryl sulfate/sodium cetearyl sulfate (Figure 4), and paraffi num liquidum the peak of avoben- zone shifted to a lower temperature, broadened, and there was also a signifi cant reduction in the enthalpy value or the enthalpy value could be the average of both substances. In the DSC scan of avobenzone–glycerine mixture, the peak of avobenzone showed broad- ening and shifting to a higher temperature (93.12°C) with an anomalous enthalpy value. Appreciable decreasing or the absence of the melting temperature and its respective val- ues of fusion enthalpy suggests a process that takes place with low intensity or even disap- pears (the case of the binary mixture of avobenzone–acetylated lanolin). A higher value of fusion enthalpy shows an overlapping of two processes (the case of the binary mixture of avobenzone–BHT). The small variations in the enthalpy values for the binary mixtures can be attributed to some heterogeneity in the small samples used for the DSC experi- ments (3–4 mg). The difference of enthalpy for the binary mixtures of avobenzone with acetylated lanolin, imidazolidinyl urea, and sorbitol 70% can suggest a physical interac- tion that does not determine an incompatibility. On the basis of the DSC results, cetearyl alcohol, isopropyl myristate, propylparaben, diethylhexyl syringylidene malonate, caprylic capric triglyceride, BHT, glycerin, cetearyl alcohol/ceteareth 20, cetearyl alcohol/sodium lauryl sulfate/sodium cetearyl sulfate, and paraffi num liquidum seem to exhibit interaction with avobenzone. These excipients were

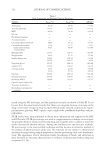
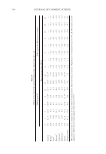
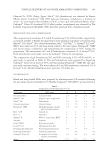
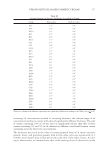
JOURNAL OF COSMETIC SCIENCE 322 tested using the IST technique, and the quantitative results are shown in Table III. It can be seen from the experimental results that there is an irregular decrease or increase in the drug content after storage of drug–excipient blends under stressed conditions for isopro- pyl myristate, glycerin, BHT, caprylic capric triglyceride, paraffi num liquidum, and pro- pylparaben. FT-IR studies were then performed to obtain more information and support for the DSC and IST results. FT-IR spectroscopy was used as a supplementary technique to investigate the possible chemical interaction between drug and excipient and to confi rm or reject the results obtained by thermal analysis. Among the nondestructive spectroscopic methods, IR spectroscopy is the most suitable technique and has become an attractive method in the analysis of pharmaceutical solids since the materials are not subject to thermal and mechanical energy during sample preparation, thereby preventing solid-state transforma- tions. The appearance of new absorption bands, broadening of bands, and alteration in their intensity are the main characteristics to evidence of interactions between drug and excipients (12, 24). Table I Peak Temperature and Enthalpy Values of Excipients Samples Tonset (°C) Tpeak (°C) ΔH (Jg-1) Avobenzone 82.99 86.40 −75.01 Ascorbyl palmitate 113.31 115.60 −133.12 BHT 69.00 70.98 −89.58 Silicone — — — Paraffi num liquidum — — — Acetylated lanolin — — — Cetearylalcohol/ceteareth 20 49.87 52.13 −63.67 Cetearylalcohol/sodium lauryl sulfate/sodium cetearyl sulfate 37.78 53.15 43.37 60.06 −74.11 −133.04 Methylparaben 125.52 126.51 −182.64 Propylparaben 96.03 97.41 −157.09 Imidazolidinyl urea 158.41 164.25 158.54 164.61 −12.60 −18.38 Propylene glycol 187.43 188.24 −409.44 Sorbitol 70% 115.60 118.82 −153.29 Cetearyl alcohol 36.63 52.46 41.08 54.93 −58.98 −108.39 Glycerin 262.45 286.54 −521.48 Isopropyl myristate 300.69 318.09 −286.32 Disodium EDTA 244.88 251.85 −97.52 Caprylic capric triglyceride — — — Titanium dioxide/silica — — — Diethylhexyl syringylidene malonate — — —
Purchased for the exclusive use of nofirst nolast (unknown)
From: SCC Media Library & Resource Center (library.scconline.org)