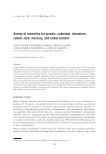
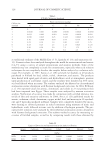
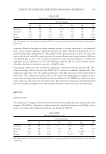
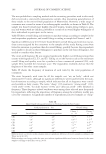
JOURNAL OF COSMETIC SCIENCE 136 • Seal and heat the vessels in an oven at 130°C for 12 h. Allow the vessels to cool. • Vent and open the vessels in a fume exhaust hood. • Transfer the solutions to centrifuge tubes and dilute to 50 ml. • For mercury analyses, transfer 4 ml of the analytical solution to another centrifuge tube and dilute to 40 ml with 5% (v/v) bromine monochloride. • Transfer the original digests to cleaned Tefl on beakers and heat on a hot plate at no more than 200°C until the volume is reduced to 2–3 ml. • Add 25 ml of concentrated HNO3 and repeat the evaporation process to a volume of 2–3 ml. • Continue the acid addition and evaporation process two more times. • Transfer the resultant solutions to 50 ml centrifuge tubes and dilute to 50 ml. • Include two method blanks in each digestion batch of no more than 20 samples to assess contamination. Table XVI. Elemental Results for 10 Face Paints from 10 Manufacturers Manufacturer Brand Mean results (mg/kg)a As Cd Cr Co Pb Hg Ni HH a 0.49 NF 4.2 0.52 4.0 NF 1.9 II a 0.22 NF 15000 1.8 0.35 TR 12 JJ a 0.55 0.15 1.3 0.096 0.24 0.0040 0.60 KK a 0.31 NF 2.2 0.16 1.9 NF 0.50 LL a 0.42 NF 3.1 0.66 0.35 TR 3.4 MM a TR NF 0.26 0.092 0.39 TR 0.17 NN a 1.4 TR 1.3 0.12 1.4 TR 0.64 OO a 0.24 NF 39 10 0.80 NF 24 PP a 0.21 NF 0.51 0.20 0.31 NF 0.50 QQ a 0.25 NF 14 0.53 0.49 NF 2.7 NF: Not found, or less than detection limit TR: Trace, or greater than detection limit, but less than quanti- tation level. a Mean results of duplicate determinations. Table XVII. Eye Shadow Summary (n = 30) Results (mg/kg) As Cd Cr* Co** Pb Hg Ni** Maximum 1.7 0.36 22000 64 (13) 14 0.040 1600 (42) Minimum NF NF 1.1 0.11 0.045 NF 0.91 Mean 0.50 0.032 940 5.5 (3.5) 4.2 0.0068 65 (12) Median 0.43 NF 11 2.6 (2.4) 4.0 0.0025 9.8 (9.6) NF: Not found, or less than detection limit TR: Trace, or greater than detection limit, but less than quanti- tation level. *Three samples appear to use chromium pigments, thus the large difference between mean and median. **Signifi cantly high values of 1600 mg/kg for Ni and 64 mg/kg Co from one sample were removed for the calculated values in parentheses.

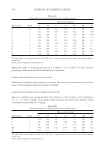
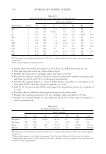
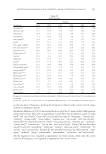
SURVEY OF COSMETICS FOR SEVEN INORGANIC ELEMENTS 137 Table XVIII. Blush Summary (n = 30) Results (mg/kg) As Cd* Cr Co Pb Hg Ni Maximum 1.3 1.2 (0.12) 400 7.5 14 0.010 23 Minimum NF NF TR NF TR NF TR Mean 0.51 0.056 NF 23 2.0 3.9 0.0027 8.0 Median 0.46 NF 6.5 1.5 3.3 NF 7.3 NF: Not found, or less than detection limit TR: Trace, or greater than detection limit, but less than quanti- tation level. *The signifi cantly high value of 1.2 mg/kg for Cd from one sample was removed for the calculated values in parentheses. Table XIX. Lipstick Summary (n = 30) Results (mg/kg) As Cd Cr Co Pb Hg Ni Maximum 0.49 NF 19 3.9 3.4 0.010 7.6 Minimum NF NF 0.18 NF TR NF 0.10 Mean 0.14 NF 2.8 0.86 1.0 NF 2.6 Median 0.13 NF 1.5 0.45 0.82 NF 1.8 NF: Not found, or less than detection limit TR: Trace, or greater than detection limit, but less than quanti- tation level. • Include one organic oil reference material (Conostan oil for non-mercury metals and SPEX oil for mercury) in each digestion batch. • Include one inorganic reference material (NIST 2702) in each digestion batch. • Prepare each sample in duplicate. ICP-MS DETERMINATION OF ARSENIC, CADMIUM, CHROMIUM, COBALT, LEAD, AND NICKEL The ICP-MS apparatus was set up to include the following isotopes: • Elements of interest: 52,53 Cr, 60,62 Ni, 75 As, 59 Co, 111,114 Cd, 206,207,208 Pb • Internal standards: 45 Sc, 115 In, 195 Pt Initial calibrations used the 8 calibration standards from Table I. Continuing calibration verifi cation (CCV) standards were analyzed after every 15 analytical solutions. The manu- facturer’s software was used to compute the linear regression and the digital to analog response ratio. The sum of lead isotopes was used to account for isotopic variation be- tween samples and standards. The isotopes bolded above were used for quantitation and all of the isotopes were used for conformation and interference assessment. Prepared sam- ples were analyzed using a dilution of 1/10 with the diluting solution. Analytical solu- tions were analyzed relative to calibration standards using internal standardization and linear regression (y = ax + blank). No analytical solutions had internal standard signals that differed by more than 40% relative to the calibration blank.
Purchased for the exclusive use of nofirst nolast (unknown)
From: SCC Media Library & Resource Center (library.scconline.org)