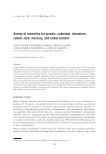
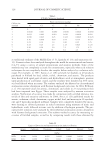
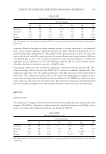
JOURNAL OF COSMETIC SCIENCE 138 Table XX. Lotion Summary (n = 5) Results (mg/kg) As Cd Cr Co Pb Hg Ni Maximum 0.19 NF TR TR 0.037 TR 0.37 Minimum 0.079 NF NF NF NF NF 0.040 Mean 0.12 NF NF NF 0.010 NF 0.11 Median 0.10 NF NF NF NF NF 0.053 NF: Not found, or less than detection limit TR: Trace, or greater than detection limit, but less than quanti- tation level. Table XXI. Premium Lotion Summary (n = 5) Results (mg/kg) As Cd Cr Co Pb Hg Ni Maximum 0.20 NF TR 0.11 0.083 NF TR Minimum TR NF NF NF NF NF TR Mean 0.14 NF 0.084 0.027 0.019 NF 0.062 Median 0.12 NF 0.084 NF NF NF 0.053 NF: Not found, or less than detection limit TR: Trace, or greater than detection limit, but less than quanti- tation level. The correlation coeffi cient for the standard curve was better than 0.997 in all cases. Con- tinuing calibration was verifi ed by analyzing a calibration blank and two QC solutions (secondary check solution and NIST 1643e reference standard) immediately after calibra- tion and after every 15 analytical solutions. The QC solution recovery was between 90% and 110%. One analytical solution from each digestion batch was diluted 1/20 with di- luting solution and compared with the same solution diluted 1/10 to verify absence of matrix effects. Relative percent differences (RPDs) for analytes in solutions at different dilutions were less than 20%. Any analytical solutions with analyte values above the highest standard were additionally diluted to determine the concentrations. CVAFS DETERMINATION OF MERCURY To avoid loss of mercury through volatilization, the analytical solutions were analyzed prior to the evaporation steps used to prepare samples for ICP-MS. As is typical in mer- cury vapor analysis, solutions were fi rst oxidized to ensure all mercury was in a stabilized oxidation state in solution, and then were reduced to form the volatile elemental mercury vapor. Initial calibrations used a blank and 5 calibration standards. CCV standards were ana- lyzed after every 15 analytical solutions. The manufacturer’s software was used to com- pute the linear regression. Oxidized solutions were treated with hydroxylamine hydrochloride to neutralize any remaining oxidant. Solutions were then treated with

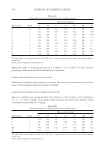
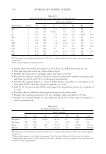
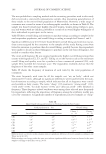
SURVEY OF COSMETICS FOR SEVEN INORGANIC ELEMENTS 139 Table XXII. Lotion with Sunscreen Summary (n = 5) Results (mg/kg) As Cd Cr Co Pb Hg Ni Maximum TR NF TR 0.045 0.10 NF TR Minimum TR NF TR NF NF NF NF Mean 0.12 NF 0.11 0.021 0.19 NF 0.036 Median 0.13 NF 0.10 0.019 NF NF 0.044 NF: Not found, or less than detection limit TR: Trace, or greater than detection limit, but less than quanti- tation level. stannous chloride through an online mixing system to reduce mercury to its elemental state. A gas–liquid separator removed the mercury vapor, which was deposited on to a gold bed through amalgamation. The gold bed was then heated to release the mercury vapor, which was carried by argon gas into the atomic fl uorescence spectrometer. Mercury was determined at 253.7 nm. Analytical solutions were analyzed relative to calibration standards using a dilution of 1/10 with diluting solution and 1% (v/v) bromine mono- chloride solution (to maintain mercury in Hg(II) state). Continuing calibration was verifi ed by analyzing a calibration blank and two QC solu- tions (secondary check solution and NIST 1641e reference standard) immediately after calibration and after every 15 analytical solutions. The QC solution recovery was between 90% and 110%. Absence of matrix effects was verifi ed by comparing one analytical solu- tion from each digestion batch with one that was diluted 1/20. RPDs for analytes in solu- tions at the two dilutions were less than 20%. Any analytical solutions with analyte levels above the highest standard were additionally diluted to determine the concentrations. RESULTS LOD/LOQ STUDY Ten replicates of reagent blanks fortifi ed with low level standards were analyzed for each element. The LODs, calculated as three times the standard deviations, and LOQs, calcu- lated as 10 times the standard deviations, are shown in Table II. Table XXIII. Mascara Summary (n = 10) Results (mg/kg) As Cd Cr Co Pb Hg Ni Maximum 0.35 NF 5.8 12 0.41 0.060 12 Minimum TR NF 0.26 0.15 NF NF 0.50 Mean 0.20 NF 1.8 2.8 0.13 0.0065 4.0 Median 0.17 NF 0.99 1.7 0.074 NF 2.3 NF: Not found, or less than detection limit TR: Trace, or greater than detection limit, but less than quanti- tation level.
Purchased for the exclusive use of nofirst nolast (unknown)
From: SCC Media Library & Resource Center (library.scconline.org)