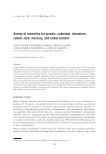
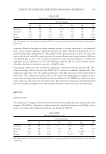
JOURNAL OF COSMETIC SCIENCE 152 between the surface of the sample and the surface of the probe. Cohesiveness (A2/A1) was the ratio of the area under curve for the second compression (A2) to that under curve for the fi rst compression (A1). Four replicate analyses were performed for each formulation at 25 ± 1°C. Physical stability study. Each sample underwent six cycles of freeze-thaw cycling. In each cycle, the sample was kept at 4 ± 1°C for 24 h following by keeping at 45 ± 1°C for 24 h. Before and after undergoing the freeze-thaw cycling, texture profi les, viscosity, and pH of each formulation using a fl at electrode (Metler Toledo in Lab surface, Greifensce, Switzerland) were examined. The viscosity of each sample was measured at 25 ± 1°C using a digital Brookfi eld Viscometer (Model DV-III+ Programmable Rheometer, Stoughton, MA) mounted on the helipath stand fi tted with a T-F spindle. The rheometer was set at 5 rpm. The apparent viscosity, expressed as centripoints (cPs), was an average of the data points collected for 30 s. Statistical analysis. Unless otherwise stated, all experiments were performed in triplicate. The effects of PVR, xanthan gum, and stearic acid on SPF and PA values as well as texture profi les among formulations were evaluated using regression analysis. The differences between before and after freeze-thaw cycling of each formulation were analyzed using a paired-samples t-test. p 0.05 denoted statistical signifi cance. All statistical analyses were performed using SPSS software. Mathematical models for 23 full factorial design were obtained, relating the responses with the experimental conditions as follows: 0 1 2 3 12 13 23 y b b A b B b C b AB b AC b BC (3), where the coeffi cients estimations were b1, b2, and b3 corresponding to the response ob- tained with the factors A, B, and C, respectively. The interaction coeffi cients were b12, b13, and b23 corresponding to the response obtained with interaction terms of AB, AC, and BC respectively. Figure 2. Texture profi le curve of a sample.

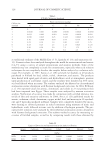
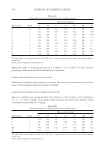
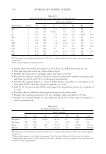
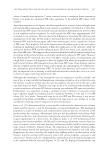
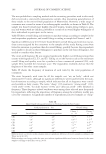
FACTORS AFFECTING SPF AND PA VALUES OF SUNSCREEN CREAM FORMULATIONS 153 Table V Corrected SPF and PA Values of Test Samples Sample SPF (cal) ± S.D. PPD ± S.D. PA (cal) F1 21.81 ± 4.28 4.45 ± 1.51 2+ F2 29.27 ± 2.75 6.59 ± 1.62 2+ F3 38.54 ± 3.11 6.57 ± 0.73 2+ F4 53.82 ± 5.41 9.78 ± 1.83 3+ F5 60.68 ± 10.89 11.99 ± 1.83 3+ F6 26.05 ± 4.35 6.72 ± 2.30 2+ F7 40.18 ± 5.73 7.17 ± 1.78 2+ F8 32.92 ± 2.3 6.05 ± 0.39 2+ F9 30.98 ± 2.43 6.83 ± 0.51 2+ RESULTS As shown in Table V, SPF and PA values of F1, F5, and F4 were 21.81/2+, 60.68/3+, and 53.82/3+, respectively. F5 and F4 appeared to have good protection against UVB and UVA. The difference between F5 and F4 was the PVR and the presence of xanthan gum. When comparing the components in F1, F5, and F4 (Tables II and III), it was found that F1 contained a low level of PVA, had no xanthan gum, and a low level of stearic acid, whereas F5 contained a low level of PVR with an absence of xanthan gum and a high level of stearic acid and F4 contained a high level of PVR and xanthan gum with low stearic acid. The formulations having high levels of PVR and xanthan gum with low levels of stearic acid (F4) appeared to possess SPF values of 53.82, which was greater than the formulation containing low levels of PVR and stearic acid with high levels of xanthan gum (F3) hav- ing an SPF value of 38.54. This indicates that formulations having a higher level of PVR and xanthan gum can improve the SPF values. In contrast, if the level of xanthan gum was low and stearic acid was high, the formulation that contains a low level of PVR (F5) was found to have an SPF value of 60.68, which was much greater than the formulation con- taining a high level of PVR (F5), which had the SPF value of only 26.05. This indicates that there is an interaction between PVR and the amount of stearic acid. Table IV SPF and PA Values Labeled on the Reference Products in Comparision with Their Corrected Values from Equation (1) and PA Grading Values from Equation (2) Sample SPF (cal) ± S.D. SPF (labeled) PPD ± S.D. PA (cal) PA (labeled) SPF 4.47 1.92 ± 0.52 4.47 – – – SPF 15 14.36 ± 2.61 15 3.53 ± 0.20 2+ – S1 12.97 ± 2.07 30 5.29 ± 0.47 2+ 2+ S2 44.19 ± 3.50 40 9.91 ± 1.02 3+ – S3 42.48 ± 8.16 50 8.37 ± 1.83 2+ 3+ S4 46.15 ± 10.23 50 15.45 ± 1.51 3+ 3+ S5 58.25 ± 0.85 60 15.12 ± 1.36 3+ 3+ S#: Sample number from a counter-brand sunscreen product.
Purchased for the exclusive use of nofirst nolast (unknown)
From: SCC Media Library & Resource Center (library.scconline.org)