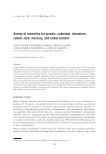
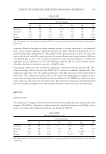
JOURNAL OF COSMETIC SCIENCE 150 propylene glycol, carbopol 940, xanthan gum, EDTA (tetra sodium), Tween 80, and de- ionized water were mixed well before adding triethanolamine. The water phase mixture was then heated in water bath to 75°C and poured into the oil phase mixture. After that, the emulsion mixture was continuously stirred until the temperature reached 45°C. Then, vitamin E acetate, propylene glycol, diazolidinyl urea, methylparaben, and propyl- paraben were added and homogenized for 5 min. Determination of in vitro SPF and PA values. An opened window in thick plastic with a dimension of 0.8 × 2 cm2 was made as a sample holder. Transpore® tape of size 1.2 × 3 cm2, which was taped one-side with transparent tape, was used as a sample plate. Sun- screen products, 2 mg/cm2, were applied evenly on the whole surface of the rough side of the sample plate. After weighing, the sample was spread using light circular strokes over the whole surface of the plate and allowed to dry for 15 min at room temperature. Seven plates were prepared for each tested sample. The transmittance of UV in a range of 290– 400 nm through the sample plate was measured against a blank plate using UV-visible spectrophotometer UV-17000 PharmaSpec (Shimazu, Japan). Determination of SPF according to the method of Diffey and Robson (6) In vitro SPF was calculated as in equation (1): λ λ λ λ 400 290 400 290 SPF /Tλ E In vitro E (1), where E(λ) is the spectral irradiance of the used light spectrum at wavelength λ nm, ∈(λ) is the erythemal action spectrum at wavelength λ nm corresponding to the International Commission on Illumination (CIE) publication (23), and T(λ) is the spectral transmit- tance of the sunscreen. The calculated SPF values were obtained from equation (1). A corrected SPF value for samples was determined using a linear regression equation plotted between the label SPF values of SPF 4.47 and SPF 15 as well as the labeled SPF and PA values of the international Table III 23 Factorial Design Layout Combination Formulation Composition A B C (1) F1 − − − A F2 + − − B F3 − + − AB F4 + + − C F5 − − + AC F6 + − + BC F7 − + + ABC F8 + + + F9 0 0 0

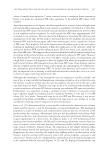
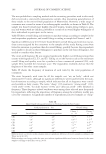
FACTORS AFFECTING SPF AND PA VALUES OF SUNSCREEN CREAM FORMULATIONS 151 counter-brand sunscreen products in Figure 1, which were found to have a good correla- tion with a determination of coeffi cient (r2) of 0.901. Determination of UVA-PF according to the method of Ferrero et al. (8) In vitro UVA-PF was calculated with spectral range of 320–400 nm as in equation (2): λ λ % %λ − ⋅ 400 320 400 m 320 1 UVA PF Invitro T T (2), where Tm is the arithmetic mean of the transmittance data in the UVA range. UVA-PF was classifi ed according to the Japan Cosmetic Industry Association into four categories as follows: UVA-PF 2: no protection against UVA 2–4 (PA+): protection against UVA 4–8 (PA++): considerable protection against UVA and ≥8 (PA+++): the greatest protec- tion against UVA (2). Instrumental texture analysis of sunscreen formulations. Each sample was packed with a height of 7 cm in a 28-ml McCartney bottles (S Murray & Co., Surrey, UK) and kept at 25 ± 1°C for 48 h before performing texture profi le analysis. The texture profi les of each formulation were determined according to Jones et al. (17) with some modifi ca- tion using a texture analyzer (Model TA.XT Plus, Stable Micro Systems, Surrey, UK). A stainless steel probe of 1 cm in diameter (P/0.5R) was compressed twice into the sample at a defi ned rate of 6 mm⋅s-1 to a depth of 1.5 cm, with a delay period of 15 s between the two compressions. Data collection and calculation were performed using the XTRA Dimension software package of the instrument. The texture profi le analysis values of hardness, compressibility, adhesiveness, and cohesiveness of sunscreen sam- ples were calculated by determining the load and displacement at predetermined points on the texture profi le analysis curve (Figure 2). Hardness was the maximum force required to attain a given deformation of the sample during the fi rst compression. Compressibility was the work required to deform the sample during the fi rst compres- sion (A1). Adhesiveness (A3) was the work required to overcome the attractive force Figure 1. Correlation between labeled SPF and calculated SPF of tested counter-brand sunscreen products.
Purchased for the exclusive use of nofirst nolast (unknown)
From: SCC Media Library & Resource Center (library.scconline.org)