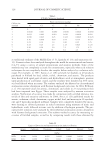
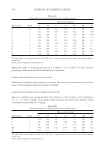
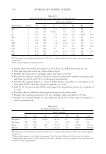
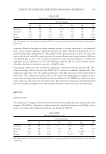
JOURNAL OF COSMETIC SCIENCE 156 Figure 3. Texture profi les, pH, and viscosity of sunscreen products before and after undergoing freeze-thaw cycling.

FACTORS AFFECTING SPF AND PA VALUES OF SUNSCREEN CREAM FORMULATIONS 157 values of samples from equation (1) were corrected using a correlation linear equation in Figure 2 to make the calculated SPF value equivalent to the labeled SPF values of the samples. Apart from sunscreen active agents, the other ingredients in cosmetic bases and application patterns also affect sunscreen effi cacy and cosmetic acceptability (25). Schulz et al. (26) dem- onstrated that SPF values of micronized titanium dioxide in hydrodispersion were less than in o/w emulsion and w/o emulsion. It could increase the SPF value approximately 40% compared to o/w emulsion. This was due to the difference in remaining fi lm thickness and irregularities on the skin. In this study, it was found that for o/w emulsion, the interaction between PVR and thickening agent, which was xanthan gum, led to a signifi cant increase of SPF value. This might be due to the improvement of xanthan gum in the water phase resulting in uniformity and thickness of fi lm after application to the substrate, while the interaction between PVR and the stiffening agent, which was stearic acid, signifi cantly re- duced the SPF value. This suggests that a sunscreen formulation which contains a high level of oil phase with low level of stearic acid might signifi cantly reduce the SPF value. However, the formulation F5 contained a low level of oil phase with the absence of xanthan gum and a high level of stearic acid appeared to have the highest SPF, while the formulation with a high level of oil phase (F6) appeared to have the lowest SPF value. These fi ndings indicate that the oil phase and the ratio of stearic acid to liquid oils containing C12-15 alkyl benzo- ate, dipropylene glycol dibenzoate, PPG-15 stearyl ether benzoate, and mineral oil may play an important role in forming a solid lipid nanostructure matrix that can act as a sun- screen by its light scattering properties (27,28). Although the advantages of the Transpore® tape are inexpensive, readily available, and ease of use, it is not suitable for formulations containing alcohol or oil as a vehicle because the product would not absorb onto the tape. In addition, the pore size of the tape could vary from batch to batch. Therefore, the tape needs to be validated with standard sun- screen formulations of known SPF before screening any unknown SPF sunscreen product. Furthermore, any ingredient causing a swelling of tape’s substrate or solvation of the tape’s adhesive might be resulting in poor correlation between in vitro and in vivo SPF values (29). As a result, Transpore® tape for in vitro SPF and PA testing is not recom- mended by the FDA or COLIPA as a substrate for sunscreen in vitro studies. It is only suitable for screening of some categories of sunscreen products. Jones et al. (17) demonstrated that texture profi le analysis for the characteristics of semi- solids could be used as a tool for development of topical formulations. The mechanical properties in terms of hardness and compressibility indicate the ease of removal of the product from the container, adhesiveness indicates the spreadability and feeling of the product on the skin, and cohesiveness indicates the structural reformation following sub- sequent applications of a shear stress. In addition, Lukic et al. (19) demonstrated that rheological and texture profi les could be used to determine preliminary sensory character- istics of cosmetic cream, and some rheology and texture profi les could be used to predict some sensory attributes. Sensory texture, the impression of the sample thickness when rubbed between thumb and forefi nger, directly correlated with hardness and yield value. Slipperiness, the area covered by the sample after rubbing with a circular motion at the forearm, directly correlates with viscosity, elastic and viscous modulus, consistency, and cohesiveness. In this study, the compressibility and hardness of each formulation appeared to be correlated with the viscosity (Figures 3a, 3b, and 3f). Among all formulations, the
Purchased for the exclusive use of nofirst nolast (unknown)
From: SCC Media Library & Resource Center (library.scconline.org)